
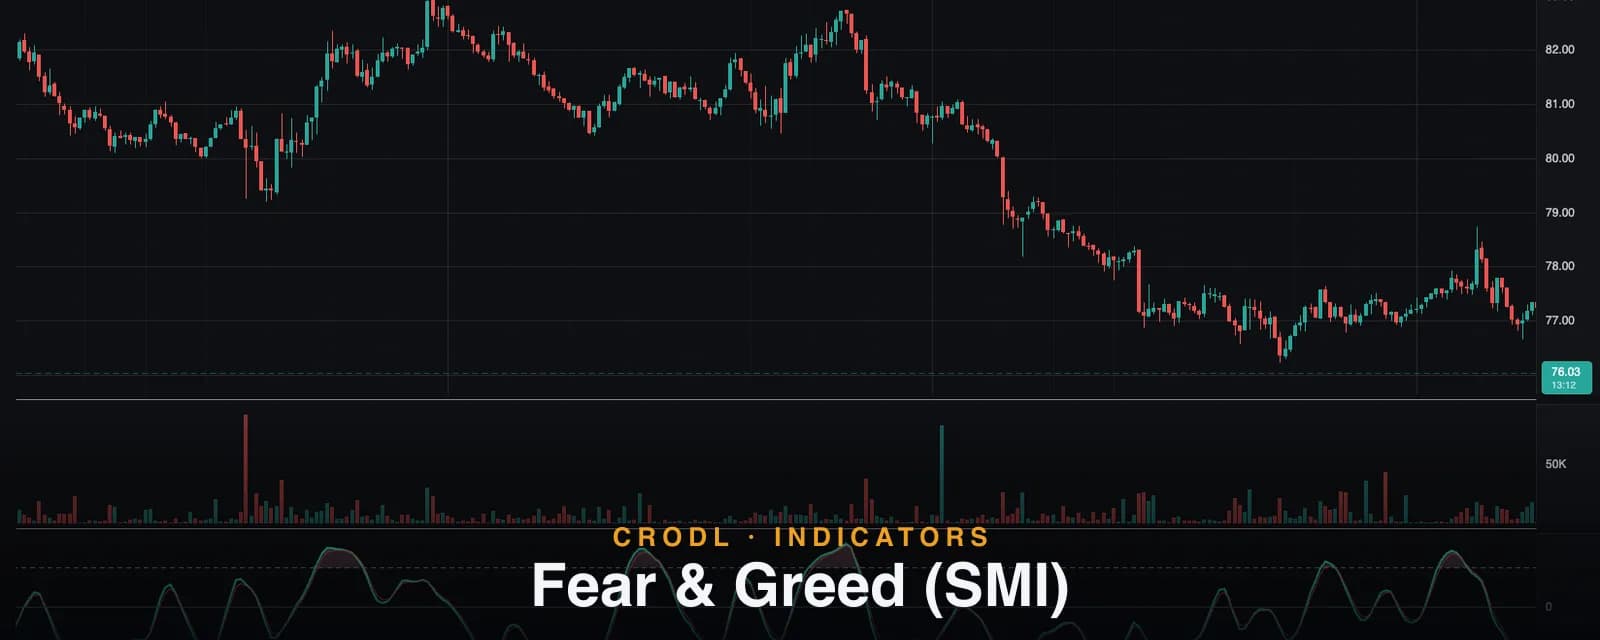
Fear & Greed (SMI)
How Crodl's Fear & Greed (SMI) indicator turns crowd emotion into a tradable signal — the Stochastic Momentum Index, ±50 greed and fear zones, and reversal alerts.
Crypto does not trade on fundamentals hour to hour — it trades on emotion. Every vertical green candle is greed compounding on greed, and every capitulation wick is fear feeding on fear. The traders who consistently buy those wicks and sell those blow-offs are not psychic; they simply have a way of measuring when the crowd has reached an extreme.
The Fear & Greed (SMI) indicator on the Crodl terminal is built for exactly that. Under the hood it is the Stochastic Momentum Index — a refined version of the classic stochastic oscillator — recast as a sentiment gauge. When the reading pushes above +50, the pane fills with a greed zone; when it sinks below −50, a fear zone fills in. The message is visual and immediate: the crowd is stretched, and stretched crowds snap back.
This post covers what the SMI actually measures, the exact parameters and signals in Crodl's preset, and the ways traders put the greed and fear zones to work.
What the Stochastic Momentum Index measures
A classic stochastic asks: where did price close within the recent high–low range? It maps the answer onto a 0–100 scale, where 100 means "at the very top of the range."
The SMI, developed by William Blau, asks a subtly better question: how far is the close from the midpoint of the recent range? It takes the distance between the close and the center of the highest-high/lowest-low span, double-smooths both that distance and the span itself with EMAs, and normalizes the result onto a −100 to +100 scale centered on zero:
- Above 0 — price is closing in the upper half of its recent range. Buyers are in control.
- Below 0 — price is closing in the lower half. Sellers are in control.
- Beyond ±50 — price is pinned near the extreme of its range bar after bar. That is not normal market behavior; it is a crowd leaning hard in one direction.
The double smoothing is the point. A raw stochastic whipsaws violently on crypto's noisy candles; the SMI's layered EMAs produce a curve smooth enough to trade crosses against, without the heavy lag of simply using a longer lookback.
How it works on the Crodl terminal
Crodl ships Fear & Greed (SMI) as a Rune preset with four functional inputs:
- Percent K Length (default 10) — the lookback for the highest-high/lowest-low range.
- Percent D Length (default 3) — the EMA length used for the double smoothing and for the final SMI line.
- Overbought (default +50) — the greed threshold.
- Oversold (default −50) — the fear threshold.
From those, the preset draws two lines and two zones in its own pane:
- The SMI line — the double-smoothed momentum reading, plotted as the main (teal) line.
- A 4-period EMA trigger line — a faster EMA of the SMI (red), acting as the signal line for crosses.
- The greed zone — a translucent fill between +50 and the SMI whenever the reading is above +50.
- The fear zone — the mirror fill below −50.
A dashed zero line marks the bull/bear midpoint, and the preset registers four alerts you can route to Crodl's alert system: bull cross and bear cross (SMI crossing its trigger line anywhere), plus the two that matter most — fear reversal (a bullish cross while both lines are below −50) and greed reversal (a bearish cross while both lines are above +50).
| Reading | Zone | What it suggests |
|---|---|---|
| Above +50 | Greed | Crowd stretched long — watch for a greed-reversal cross |
| 0 to +50 | Bullish | Buyers in control, trend-following conditions |
| −50 to 0 | Bearish | Sellers in control, rallies suspect |
| Below −50 | Fear | Crowd stretched short — watch for a fear-reversal cross |
How traders use it in crypto
Fading the extremes — with confirmation
The lazy way to trade any oscillator is to short the moment it enters overbought. In crypto that is a donation: strong trends can pin the SMI above +50 for days. The preset's reversal alerts encode the disciplined version — you wait for the SMI to cross back through its trigger line while still inside the extreme zone. The fear-reversal signal (bullish cross below −50) means the panic was there and momentum has already turned. That distinction is the difference between catching a knife and catching a bottom.
Zero line as a regime filter
Between the extremes, the zero line splits the market into regimes. Many traders only take longs while the SMI holds above zero and only shorts below it, using crosses of the trigger line as entries in the direction of the regime. It is a simple filter that keeps you off the wrong side of a trending market.
Divergence at the extremes
When price prints a lower low but the SMI prints a higher low inside the fear zone, selling pressure is exhausting even as price ticks lower — a classic setup covered in depth in our divergence guide. Divergences that form inside the ±50 zones carry far more weight than ones near zero.
Pair it with a volume gauge
The SMI is computed purely from price — it can tell you the crowd is stretched, but not whether real money agrees. Pairing it with a volume-flow tool like the Money Flow Index or OBV is the standard upgrade: a fear-reversal cross that coincides with a bullish OBV divergence is a much higher-conviction long than either signal alone.
Frequently Asked Questions
How is the SMI different from a regular stochastic?
A regular stochastic measures the close against the range extremes on a 0–100 scale; the SMI measures it against the range midpoint on a ±100 scale, with double EMA smoothing. The result is a smoother, zero-centered curve that supports both extreme-fading and regime-filtering, where the classic stochastic mostly supports the former — see our RSI guide for how it compares to the other classic momentum oscillator.
Why are the thresholds ±50 instead of 80/20?
Because the scale is different. The SMI spans −100 to +100 around zero, so ±50 plays the same statistical role that 80/20 plays on a 0–100 stochastic: readings beyond it are genuinely uncommon. Both thresholds are adjustable in the preset if you want stricter or looser zones.
Does it repaint?
No. The SMI is built from EMAs of completed values — once a bar closes, its reading is fixed. Like any oscillator, the value on the currently forming candle moves with live price until that candle closes.
Which timeframes does it work on?
All of them, but the character changes. On low timeframes the ±50 zones are hit constantly and work best with the regime filter; on 4h and daily charts, a visit to the fear zone is a rarer, heavier event — those are the readings swing traders wait weeks for.
Put a sentiment gauge on your chart
Fear & Greed (SMI) is available on every Crodl terminal chart — add it from the indicator picker, set your alerts on the reversal signals, and let the terminal tell you when the crowd is stretched, alongside live trading on six exchanges.
This article is for educational purposes only and is not financial advice. Leveraged trading carries substantial risk of loss. Always do your own research and never risk more than you can afford to lose.

Ready to automate your trading?
Connect your exchange, set up automations, and start trading smarter — all from one platform.
Start Trading Free