Range Filter Buy & Sell
Filter price through a double-smoothed range, shade target bands, and mark strictly alternating breakouts on the chart or a higher timeframe.
Price is noisy, but not every tick deserves a moving average response. A range filter asks price to travel farther than its recent normal movement before the reference line is allowed to move. Inside that threshold, the line stays flat. Outside it, the filter steps after price while preserving a volatility-sized buffer.
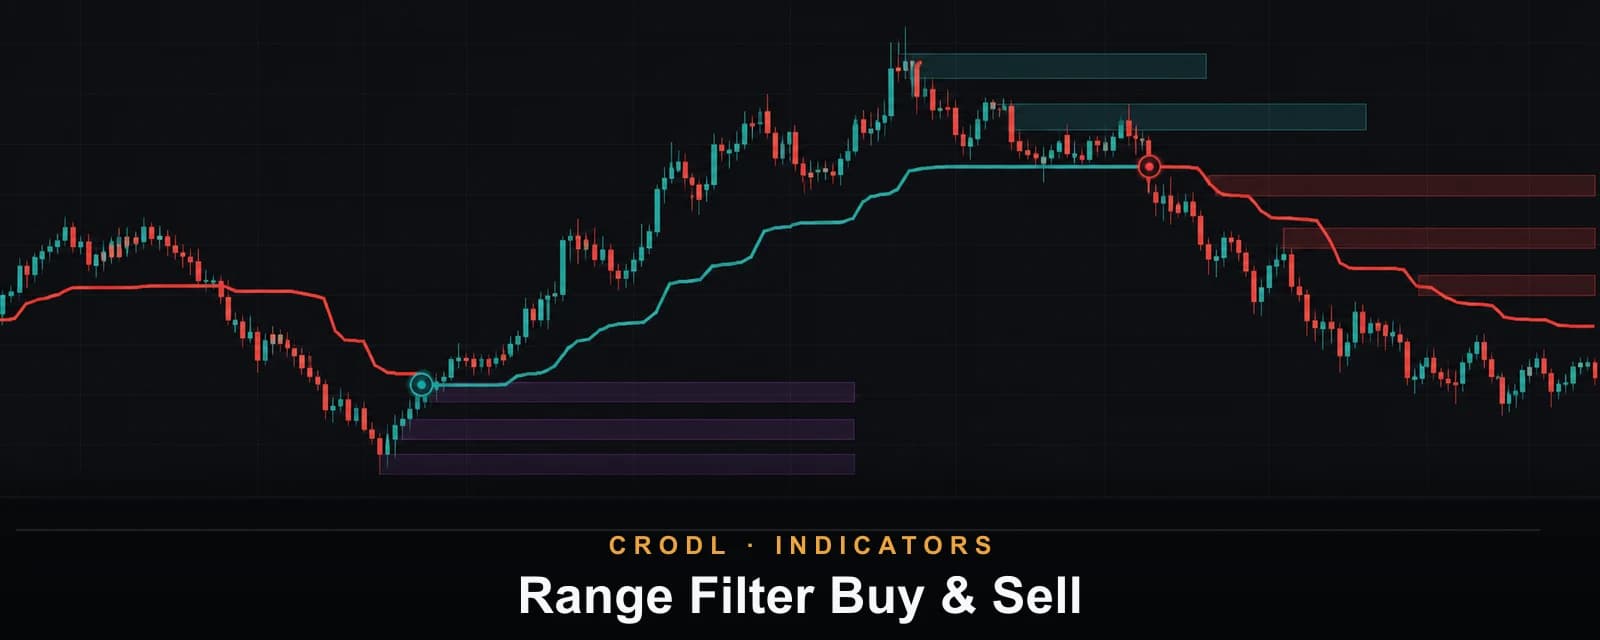
Range Filter Buy & Sell on the Crodl terminal is the indicator twin of the DonovanWall/guikroth “Range Filter Buy and Sell 5min” formulation. It plots the direction-colored filter, optional target bands, and strictly alternating BUY/SELL breakout labels without placing simulated trades.
How the range is estimated
The selected source—Close by default—is compared with its previous value. The absolute change is smoothed twice:
- An EMA over the Sampling Period, 100 bars by default.
- A second EMA over
2 × period − 1bars.
That smooth average range is multiplied by Range Multiplier, 3.0 by default. The two-stage smoothing reduces the influence of one abnormal candle and produces the movement threshold used by the filter.
How the filter moves
The prior filter value is the anchor. When source is above it, the line moves up only if source − smoothed range is also above the old filter. When source is below, it moves down only if source + smoothed range is below the old value. Otherwise it stays exactly flat.
The line is teal while rising, red while falling, and amber while flat. Upper and lower targets sit one smoothed range above and below the filter. Their fills are visible by default; the dashed boundary lines are optional.
This is why the tool behaves differently from an EMA: it filters movement by distance, not by averaging every new price into the line.
What creates BUY and SELL labels
A raw long condition requires price above a rising filter. A raw short requires price below a falling filter. The indicator then applies an alternation gate: a BUY can print only when the last accepted signal was SELL, and a SELL can print only after BUY.
That rule prevents a trend from printing the same label on every qualifying candle. It also means the first raw condition on the loaded history initializes the side without necessarily producing a label; signals represent confirmed side changes, not every continuation bar.
BUY and SELL conditions are available as alerts.
Multi-timeframe mode
Choose Chart, 5m, 15m, 30m, 1H, 4H, or 1D. The source, double-smoothed range, filter recursion, and direction counters all evaluate in the selected timeframe. On a lower chart, the state steps only as completed measure-timeframe buckets arrive.
That matters for fidelity. A 4-hour range filter projected onto a 15-minute chart is the actual 4-hour calculation, not a 15-minute approximation with a longer period.
Settings that matter
- Source selects Close, Open, High, or Low.
- Sampling Period controls how much history defines normal movement.
- Range Multiplier controls sensitivity. Lower values move and flip faster; higher values create broader dead space.
- BUY / SELL labels can be hidden without disabling alerts.
- Show Target Bands draws dashed boundaries; Shade Target Ranges fills the distance between each target and the filter.
- Rising, falling, flat, and target colors are independently editable.
How traders use it
Trend participation
Treat a rising filter as long-side permission and use pullbacks toward the filter or lower target range for location. The line is not a stop by itself, but a close through it with a later SELL flip is evidence that the prior direction no longer controls the range.
Breakout confirmation
A range break that also prints after Trender leaves a holding state stacks two different noise filters: one based on smoothed travel, one based on model uncertainty and change-point evidence.
Higher-timeframe filter, lower-timeframe entry
Set the range filter to 4H and take only 15-minute setups in its direction. This reduces fast-chart label churn while preserving precise execution.
Frequently Asked Questions
Why are there fewer labels than raw crossings?
Signals must strictly alternate. Repeated long conditions after a BUY are continuation, not a new BUY.
Why is the filter flat while price is moving?
Price has not cleared the smoothed-range threshold from the previous filter value. The flat segment is the intended noise rejection.
Is this a strategy?
This picker item is an indicator: it draws and alerts but does not simulate entries. A strategy twin exists separately for backtesting the signal rules with fees and execution assumptions.
Filter distance, not every tick
Add Range Filter Buy & Sell from the Crodl indicator picker for a volatility-aware rail and sparse alternating breakouts that stay consistent across chart and higher timeframes.
This article is for educational purposes only and is not financial advice. Leveraged trading carries substantial risk of loss. Always do your own research and never risk more than you can afford to lose.

Ready to automate your trading?
Connect your exchange, set up automations, and start trading smarter — all from one platform.
Start Trading Free