Every Drawing Tool on the Crodl Chart: The Complete Guide
A map of all 51 drawing tools on the Crodl chart — lines, channels, Fibonacci, pitchforks, patterns, positions, measurement and annotation — and when to reach for each.
Indicators compute. Drawing tools remember.
That distinction is the whole reason a chart has both. An indicator answers a question you have already framed — is the trend up, is momentum fading — and it answers it the same way on every chart, forever. A drawing answers a question only you asked: this level, the one price rejected three times in March, is it still there? No indicator knows that level matters. You do, and the drawing is how you tell the chart.
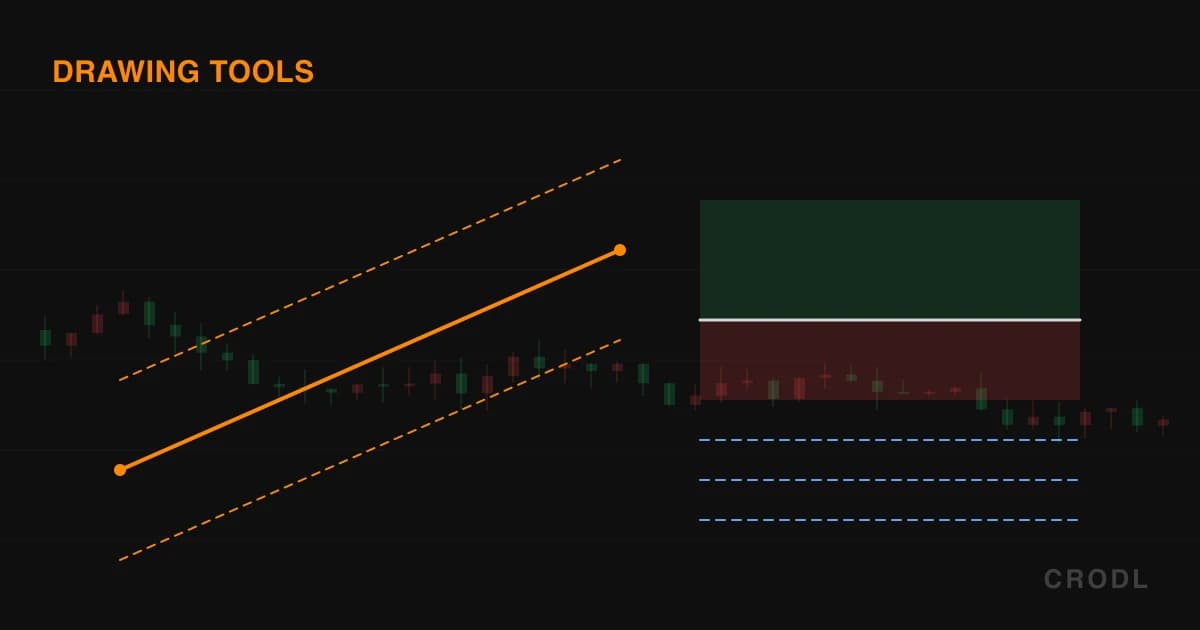
The Crodl chart ships 67 drawing tools, grouped into flyouts down the left edge of the chart. That is a lot of surface, and most traders use six of them. This guide is the map: what each family is for, when it earns its place on a chart, and where to read the detail.
How the toolbar works
Every tool lives behind a group button on the drawing toolbar. Click the button to activate that group's primary tool, or click the small caret beside it to open the flyout and pick any tool in the family. The most-used tools also carry Alt shortcuts — Alt+T for a trend line, Alt+F for Fibonacci, Alt+L for a long position.
Placement is uniform: one-click tools commit where you click, and multi-click tools plant one anchor per click and commit on the last one. Once a drawing exists, selecting it opens a context bar with its colour, line style, width, visibility and lock controls — plus any options specific to that tool. Drawings save with your layout, restore on reload, and stay pinned to the price bars they were drawn against rather than floating away when you scroll or change timeframe.
The families
Lines — the ones you will actually use
Trend lines, rays, extended lines, horizontal levels and vertical time markers. This family is the bulk of most people's chart work, because most chart work is one question: where is the level, and is it still holding? It also holds two quieter tools worth knowing — the trend angle and the info line, which report the slope and the move's statistics as you draw.
→ Trend Lines, Rays and Guides: Every Line Tool on the Crodl Chart
Channels — a trend with edges
A trend line tells you the direction; a channel tells you where the move is stretched. Five of them here: the classic parallel channel, the statistical regression channel, flat and disjoint variants, and the newest addition — the ATR channel, which sets its rails at a multiple of Average True Range so the width is the instrument's own volatility rather than a number you eyeballed.
→ Channel Drawing Tools: Five Ways to Frame a Trend
Fibonacci and Gann — proportion tools
Retracements, extensions, fans, time zones, circles, the Fib channel, and the Gann fan and box. The retracement is the second tool most traders learn and the one they keep; the rest are specialist instruments with real followings and real critics. The guide is honest about which is which.
→ Fibonacci & Gann Drawing Tools on the Crodl Chart
Pitchforks — equilibrium and reaction
Andrews' pitchfork and its Schiff variants draw a median line through the middle of a swing and project tines either side of it. The idea underneath is that price oscillates around a moving equilibrium; the median is that equilibrium, and the tines are where the oscillation usually stops.
→ Pitchforks on Crodl: Andrews', Schiff and Modified Schiff
Harmonic patterns — ratio-defined reversals
XABCD, ABCD and Three Drives, for traders who work with Gartley/Bat/Butterfly-style structures where the legs must hold specific proportions to each other. These are manual drawing tools: they let you mark the structure precisely, but they do not vet the ratios for you.
→ Harmonic Pattern Tools: Drawing XABCD, ABCD and Three Drives
Elliott wave — labelling the count
Five label sets covering the impulse, the ABC correction, the ABCDE triangle, and the WXY and WXYXZ combinations. If you count waves, these put the labels on the chart cleanly. If you do not, skip the family entirely — nothing else depends on it.
→ Elliott Wave Drawing Tools: Five Label Sets for the Count You Actually See
Positions — the trade before the trade
Four tools that draw entry, stop and target as filled zones with a live risk/reward readout. The classic long and short seed a 1:1 setup sized from recent ATR and derive quantity from a risk budget. The newer ATR pair prices the whole plan in volatility: a stop at 1×ATR and a take-profit ladder at 1× through 8×, which means at the default stop the rung number is the R multiple. This is the family that changes behaviour rather than just decorating a chart.
→ Position Tools: Draw the Trade Before You Take It
Measurement — how far, how long, how expensive
Price range, date range, the combined date-and-price range, and the premium/discount tool that splits a dealing range into expensive and cheap halves around its equilibrium. Quick, disposable tools: you draw them, read the number, and delete them.
→ Measurement Tools: Price Range, Date Range and Premium/Discount
Shapes and annotations — the chart as a notebook
Rectangles, ellipses and triangles for marking zones you intend to trade against later; text, callouts, price labels and arrow marks for leaving notes to your future self. Underrated: the trader who writes "failed here twice, third time I take it" on the chart in March is far better prepared in June than the one who trusted memory.
→ Shapes & Annotations: Turning Your Chart Into a Research Journal
Freehand and curves — for what a straight line cannot say
Path, polyline, brush, highlighter, arc, curve and double curve. Not every structure is a straight line: a decaying trend curves, a rounded base arcs, and sometimes you just want to shade a messy region while you think. This family is the loose-handed end of the toolbar.
→ Freehand and Curve Tools: Drawing What a Straight Line Cannot
Volume profile — where the business was done
Two profile tools, one anchored to a range you pick and one running from an anchor to the live edge. Where every other tool asks when something happened, these ask at what price — turning a stretch of chart into a histogram of traded volume, with the point of control marking the price that saw the most business.
→ Volume Profile Drawing Tools: Fixed Range and Anchored
Notes and pins — messages to your future self
Sticky notes, price notes, pins and comments, plus the circle, rotated rectangle and position forecast. The annotation family that expects words rather than geometry: place one, type into it, and it is waiting the next time the same level matters.
→ Notes, Pins and Comments: The Chart That Talks Back
Anchored VWAP — a drawing that computes
The exception to the opening rule. Anchored VWAP is built as a drawing tool because its defining input is a moment you choose — click the capitulation candle, the breakout, the listing — and it plots the volume-weighted average price paid since exactly that bar.
→ Anchored VWAP: The Average Price Paid Since the Moment That Mattered
Where to start if you are new
Ignore 45 of them. Seriously.
Start with the horizontal line and the trend line. Mark the levels price has actually reacted to, and the slope it has been respecting. That is 80% of the value of the entire toolbar, and it is where every experienced chartist spends most of their clicks.
When those feel automatic, add one tool per problem you actually have. Getting stopped out on noise? The ATR channel shows you what normal volatility looks like on that instrument. Sizing inconsistently? A position tool forces the stop and the size to exist before the entry does. Losing track of why you marked something? Annotate it.
The tools that stay on your chart should be the ones that answer a question you keep asking. Everything else is decoration, and decoration costs you — a chart with forty drawings on it is a chart you cannot read.
Honest limitations
Drawings are opinions, not signals. Nothing in this toolbar validates itself. A trend line drawn through the wrong pivots is still a trend line; a harmonic pattern whose ratios are 20% out still renders. The tools are precise about geometry and silent about whether your geometry is any good.
They do not place orders. Position tools in particular look like trade tickets and are not — they are planning overlays. The numbers on the box are yours to carry to the actual ticket.
Confluence can be manufactured. Given enough drawing tools, any level can be made to look significant. The discipline is deciding what matters before you start drawing, not discovering it afterwards by adding tools until something lines up.
Some families are contested. Gann and harmonics have devoted followings and serious critics. We ship them because traders use them and ask for them, not because we are claiming they are predictive. The individual guides say so plainly.
Frequently Asked Questions
Do drawings survive a reload or a timeframe change?
Yes. Drawings persist with your layout and restore on reload, and they are anchored to bars rather than pixels — so switching timeframe keeps them attached to the same points in time rather than sliding out of place.
Can I use these on a sub-pane, like the volume or an oscillator?
Most of them, yes. A few are deliberately locked to the price pane — the ATR channel and the ATR position tools among them — because a level priced in the instrument's own range has no meaning plotted over an oscillator's scale.
How do I change a drawing's colour or delete it?
Select it. A context bar appears with colour swatches, line style, width, visibility and lock, plus that tool's own options — the take-profit rungs on an ATR position, the levels on a Fibonacci, the multiplier on an ATR channel. Delete removes the selected drawing; you can also hide it if you want it back later.
Which tools have keyboard shortcuts?
The common ones: Alt+T trend line, Alt+R ray, Alt+A arrow, Alt+H horizontal line, Alt+V vertical line, Alt+F Fibonacci, Alt+X Fib extension, Alt+B rectangle, Alt+P parallel channel, Alt+G regression channel, Alt+W anchored VWAP, Alt+L long position, Alt+S short position, Alt+N text. The rest are picked from their flyout.

Ready to automate your trading?
Connect your exchange, set up automations, and start trading smarter — all from one platform.
Start Trading Free