Notes, Pins & Position Forecast: The Chart as a Place You Leave Messages
Note, Price Note, Pin and Comment anchor typed text to a candle. Circle and Rotated Rectangle mark what a box cannot. Position Forecast projects a move with a confidence cone.
You will not remember why you cared about this level. Three weeks from now you will open the same symbol, see the same wick, and have no idea whether you were waiting for a reclaim or already stopped out of one. The chart remembers the price. It does not remember you.
Crodl's newest drawing tools fix that asymmetry. Four attach typed text to a specific candle, two draw shapes the rectangle cannot, and one extrapolates a move you have already seen while being honest about how uncertain that is. They sit alongside the tools in the shapes and annotations guide, and none has a keyboard shortcut — reach for them through the toolbar flyouts down the left edge.
The note family: messages you leave for your future self
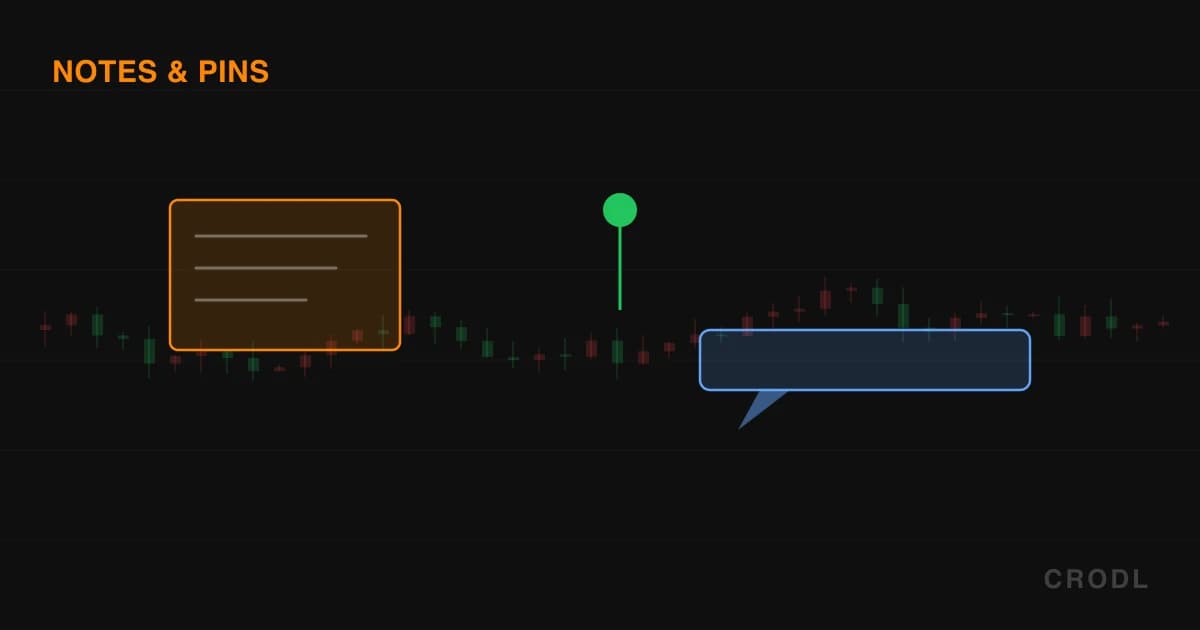
Note, Price Note, Pin and Comment all live in the Annotate flyout and behave identically at placement. Pick one, click a candle, and an inline text field opens at that exact pixel, focused, carrying a hint specific to the tool — Add a note…, Describe this price…, Add a pin label…, Add a comment…. Enter commits, Escape discards, clicking away commits what you typed. Type nothing and no drawing is created. The field caps at 100 characters.
Each stores one anchor plus your words and a font size, so none can drift out of alignment with the bar it describes. Select one and the context bar's settings popover gains two rows the other drawings lack: Label, which rewrites the text, and Size, accepting 10 through 32.
Note
The roomiest of the four: roughly six wrapped lines of about thirty characters. A rounded card sits up and to the right of the anchor, joined by a short leader line, dark and translucent, outlined in the drawing colour, with a colour tab down its left edge that survives even with labels switched off. Amber by default. This is where the actual reasoning goes.
Price Note
Same idea, aimed at a number. The card centres vertically on the anchor with a horizontal leader line and reserves a bottom row printing the anchored price, formatted for the instrument. Your text sits above it, limited to about two lines of twenty-four characters. Cyan by default. Use it where the level matters as much as the comment: "filled here", "old daily high".
Pin
The marker for something you want to find again while scrolling: a teardrop, with a filled disc floating just above the anchor, a tapered tail down to the exact point, and a punched-out dot at the centre so it stays legible on a dense chart. A rounded label pill sits above it, holding about two lines of twenty-two characters. Orange by default.
It is also the most disciplined about labels: switch Labels off on a pin and the pill is not merely hidden, it is removed from the drawing's clickable area, so an invisible label cannot steal a click meant for the chart.
Comment
A speech bubble with a filled tail pointing down at the anchor. Roughly the same capacity as Note, violet by default. The visual difference carries the semantic one: a Note is a standing instruction, a Comment is a remark about the candle you tagged. "Third rejection here."
Two shapes the rectangle could not draw
Both live in the Shapes flyout and render as a faint translucent fill inside a stroked outline.
Circle takes two clicks: the centre, then any point on the rim. The radius is the distance between those two projected points, so the result is a true circle on screen at every zoom level, not an ellipse squashed by the price scale. Green by default, with a centre handle and a rim handle. The tradeoff: the price-and-time region it covers shifts when you zoom the axes unevenly, so it marks here, roughly this big, not a specific band.
Rotated Rectangle takes three clicks. The first two set a baseline at any angle — the whole point, because trending consolidations and diagonal channels do not sit square to the time axis. The third sets thickness perpendicular to that baseline; only the perpendicular component counts, so sliding that click along the baseline changes nothing. Handles sit on both baseline ends plus a width handle at the far edge's midpoint. Violet by default.
Position Forecast: extrapolate a move, then admit the error bars
It sits in the Positions flyout but is a different animal. The position tools plan a trade: entry, stop, target, quantity, risk. Position Forecast plans nothing — it takes a move you have already observed and asks what happens if that pace continues.
Two clicks define the source move, and the tool always projects from the later of the two bars regardless of click order or how you drag the handles afterwards, so a forecast can never run backwards. From there it measures price-per-bar and extends it: 20 bars ahead by default, at a projection multiplier of 1, with 68% confidence.
Four things render — the observed leg in your line style, a dashed forecast leg with an arrowhead, a translucent confidence cone opening from the last observed point out to the horizon, and a summary card reading the projected price and percentage change, then N bars · C% ±band. The band is capped, so one malformed candle cannot produce a cone that destroys auto-scale.
The cone is the honest part. Per-bar volatility is the standard deviation of close-to-close changes between your two anchors, scaled by the confidence z-score and the square root of the horizon. Widen the horizon and the cone widens too, because a longer projection genuinely is less certain.
A third handle sits at the forecast tip and edits settings rather than geometry: drag it horizontally for horizon, vertically for the projection multiplier. Only the two anchors and three numbers are saved, all three editable in the context bar — Horizon (bars) 1 to 500, Projection × -10 to 10 (negative inverts the move), Confidence % 50 to 99. The tool is locked to the price pane.
Honest limitations
Position Forecast is a straight line with error bars, and markets are not straight lines. The cone assumes something close to a random walk, so it describes dispersion, not a probability you can trade against — it knows nothing about levels, sessions, funding or news. Volatility is sampled only from the bars between your two anchors, so a three-bar source move produces a badly estimated cone that still looks authoritative.
The annotations truncate by character count rather than measured glyph width. A Pin holds roughly forty characters before ending in an ellipsis; a Price Note not much more. The full text stays in the Label field, but the chart shows the short version, so write the short version deliberately. One rough edge: two spaces between words can make a note render a trailing … even though nothing was cut.
None of these seven tools has a shortcut — note that Alt+N is the older Text tool, not Note. And nothing here alerts or syncs to a journal. These are notes to yourself, in the only place you will actually reread them.
Frequently Asked Questions
What is the difference between Note, Comment and the plain Text tool?
Text is a bare chip with no anchor line — words floating where you put them. Note draws a leader line back to a specific candle and holds more text. Comment is a speech bubble whose tail points at the bar. They overlap functionally; what differs is what each shape signals when you return to it.
Can I change the words after the note is placed?
Yes, for all four. Select it and use the Label field in the context bar's settings popover, with Size beside it. Unlike the older Callout, these four also let you type at placement time, so that field is a revision path rather than the only route to words.
Does Position Forecast predict where price is going?
No, and it is built not to pretend otherwise. It extends an observed slope and draws a widening cone of uncertainty around the result. Treat the dashed line as "if this pace held" and the cone as "and here is how little that is worth."
Can I put these on an indicator pane?
The four annotations, yes — Note, Price Note, Pin and Comment can anchor in a sub-pane to mark something on an oscillator. Position Forecast cannot: everything it projects is a price.
Write it down while you still know why
Open the Crodl terminal, find the level you have been watching, and drop a Pin on it with three words explaining what you are waiting for. The full toolbar is catalogued in the drawing tools guide, but the tool that pays off most is the one holding the sentence you will have forgotten by the time it matters.
This article is for educational purposes only and is not financial advice. Leveraged trading carries substantial risk of loss. Always do your own research and never risk more than you can afford to lose.

Ready to automate your trading?
Connect your exchange, set up automations, and start trading smarter — all from one platform.
Start Trading Free