Position Tools: Draw the Trade Before You Take It
Crodl's chart has four position tools: classic long/short with a live risk/reward card, plus ATR variants that price the stop and target ladder in volatility.
Most losing trades are not lost at the exit. They are lost in the three seconds between "this looks good" and the click, when the entry is decided and the stop is not. You size after you are in, and you find the stop after price has moved against you — and by then the level you pick is not analysis, it is negotiation.
Position drawing tools make you answer the question first, on the chart, in pixels: where is the entry, where is the invalidation, where are you taking profit, and what does that ratio look like next to the structure you are trading? Crodl's chart has four of them, in the Positions flyout on the drawing toolbar down the left edge: Long Position (Alt+L), Short Position (Alt+S), and the newer volatility-scaled pair, Long Position (ATR) and Short Position (ATR).
The classic pair: one click, a full plan
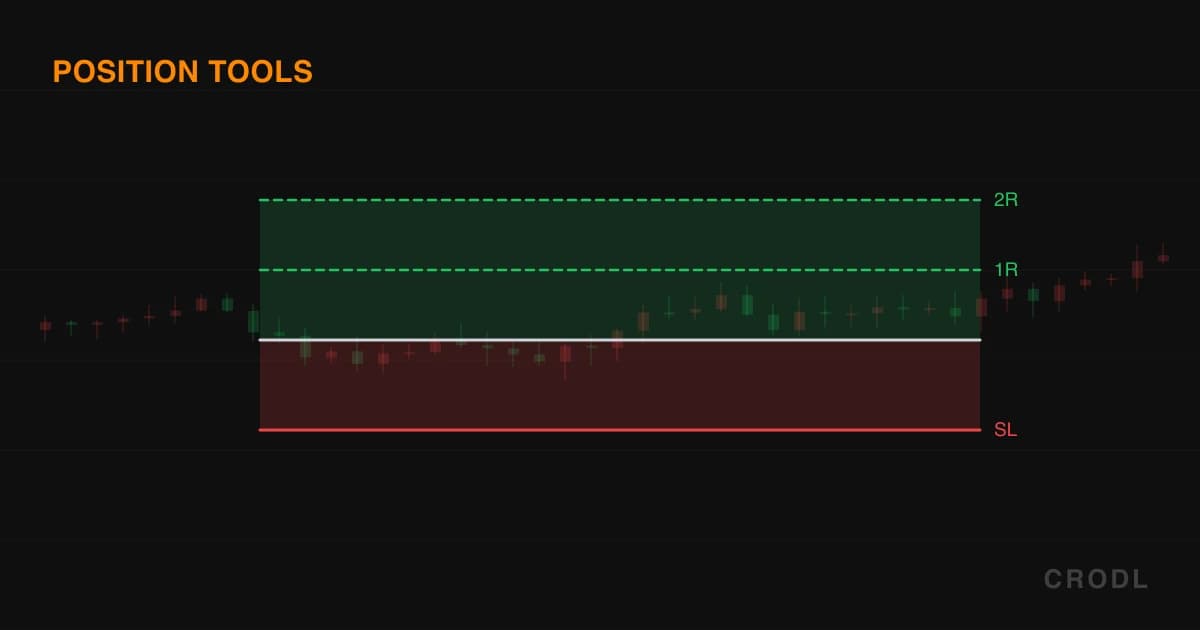
Pick Long Position, click a candle, and the entire structure is already there. No dragging out a box, no second click. The click price becomes the entry, and the tool seeds a symmetric 1:1 setup around it — target above, stop below — spanning 30 candles to the right.
The distance is the part worth knowing. It is not a flat percentage: on placement the tool takes the last 20 candles on your chart, computes a mean true range across them, and sets the stop 1.5 × ATR from the entry, with the target the same distance the other way. A fresh box on a quiet pair is tight, the same box on something violent is wide — the default already respects the instrument. Only when ATR cannot be computed at all does it fall back to a flat 1% of entry.
Short Position is the exact mirror. Both render as two filled zones split by a thin neutral entry line, green for profit and red for loss, with the zone edges deliberately unstroked so the boxes read as solid areas rather than framed rectangles.
What the card and the pills tell you
The right-edge price pills are always on, selected or not: target price with its distance from entry as a percentage, entry price alone, stop price with its own percentage. Green, muted, red. If the box runs to the edge of the canvas the pills flip inside the right edge rather than clipping off.
Select the drawing and a summary card appears on the entry line with the numbers a size decision needs:
- Open P&L — marked against live price, in the tool's direction. Longs profit as price rises, shorts as it falls.
- Qty — the one people miss. Quantity is not typed, it is derived: risk budget divided by stop distance. Move the stop closer and the position gets bigger, widen it and it shrinks, so the money at risk stays constant.
- Risk/reward ratio — reward distance over risk distance, recomputed the instant any level moves.
The risk budget defaults to $100 and is editable per drawing via Risk $ in the context bar. That single field turns the box from a picture into a size — the discipline the risk management basics post argues for, except you are looking at it instead of remembering it.
Four handles shape it afterwards. Entry (middle-left) drags the entry price only, clamped between stop and target so the zones can never invert into a nonsense positive R:R. Target and stop (top-right, bottom-right) each move their own price. End (middle-right) drags the right edge, and target and stop share that edge so they stay in lockstep. Drag the body to move the whole thing.
The ATR pair: a ladder priced in volatility
The classic tools think in prices and percentages. The ATR pair thinks in one unit only: the instrument's own average range. One click plants the entry midline, and everything else derives from there:
- The stop sits at a multiple of ATR on the protecting side — below entry for a long, above for a short. Default multiplier: 1.
- The take-profit rungs sit at n × ATR for n = 1 through 8. Only rungs 1 and 2 ship enabled; a fresh tool stays readable and the other six are one click away.
Stops render as a solid red line, targets as dashed green ones, each with its own right-edge pill. The stop pill reads SL, the price, and the multiplier in use. Each target pill reads its rung number, the price, and the R multiple — and a rung keeps its ladder number even when the rungs below it are off, so TP5 is always TP5.
That R label is the whole point. At the default 1×ATR stop, the rung number is the R multiple. TP3 is +3R, TP7 is +7R. You are not computing ratios, you are reading a ruler. Change the stop to 1.5×ATR and the labels honestly recompute — TP3 becomes 2.0R — but the default is a setup where the ladder and your risk speak the same language.
Both settings live in the context bar when the drawing is selected: SL (×ATR) as a number field (0.1 to 10), and TP (×ATR) as a row of eight toggle buttons. Turning every rung off is legal, not a bug — stop-only planning, marking invalidation and leaving the exit discretionary, is a real way to trade.
Why the ATR is frozen
The ATR is measured once, when you place the tool, and stored on the drawing — not recomputed on every repaint. A setup you mapped on Sunday still shows Sunday's stop and Sunday's ladder on Wednesday, even if volatility has doubled in between. If the levels drifted with live ATR, your stop would crawl away from the level you actually chose and the R labels would describe a trade you never planned. Freezing the unit makes the drawing a record of a decision rather than a running calculation.
Dragging follows the same logic. Drag the entry and the whole ladder travels with it, because everything is priced off the entry. Drag the stop and the tool re-derives the multiplier from the new distance, clamped to 0.1–10, so every rung's R label stays true. Drag the end handle to change how far right the box extends. Both ATR tools are locked to the price pane — a ladder priced in the instrument's own range is meaningless over an oscillator.
Which one to reach for
| Classic Long/Short | Long/Short (ATR) | |
|---|---|---|
| Shaped by | Prices you choose | The instrument's volatility |
| Reads in | Percent and R:R ratio | R multiples, directly |
| Exits | One target | Up to eight rungs |
| Shows size | Qty from a risk budget | No — levels only |
| Stop distance | Seeded at 1.5 × ATR, then yours | 1 × ATR, adjustable in ATR units |
| Shortcut | Alt+L / Alt+S | None |
Use the classic pair when the levels come from structure — the stop under that swing low, the target at that resistance — and you want the ratio and the size to follow. Use the ATR pair when the levels come from volatility: scale-out plans, R-based journaling, or any system where "two ATR" is the rule. For the same unit as a running indicator, see the ATR guide and ATR Bands.
Honest limitations
These do not place orders. Nothing here touches an exchange. They are planning overlays — drawings on a canvas, saved alongside your trendlines. The Open P&L on a classic position is hypothetical: what the position would be doing, marked against live price, for a size derived from a risk budget you typed. To put the trade on you still use the Trade Ticket.
The quantity figure is a pure division with no fees, funding, slippage, leverage or margin check in it. It will not tell you the size is impossible on your account.
The ATR pair shows no P&L and no quantity at all — it is deliberately a levels tool. And the ATR it freezes is a mean true range over the last 20 candles at the timeframe you were on when you clicked, so the same tool placed on a 5m chart and a 4h chart gives very different ladders. Correct behavior, but it makes the timeframe you draw on part of the plan.
Finally, the classic tools seed 1:1 because a neutral starting point is honest, not because 1:1 is a good trade. It is a shape, not a recommendation.
Frequently Asked Questions
How is the quantity calculated?
Risk budget divided by stop distance. The budget is the Risk $ field in the context bar, $100 by default per drawing; the distance is entry minus stop in price terms. Tightening the stop raises the quantity and widening it lowers the quantity, so the dollar risk stays fixed — which is the point.
Why doesn't my ATR position update when volatility changes?
By design. The ATR is captured when you place the tool and stored on the drawing, so a planned trade keeps the levels you planned. To re-measure against current conditions, delete and re-place it — or drag the stop, which re-derives the multiplier from where you put it.
Can I run more than two take-profit rungs?
Yes — eight, in any combination. Select the ATR position and toggle rungs 1 through 8 in the TP (×ATR) row of the context bar. Only 1 and 2 are on by default to keep a fresh drawing readable, and you can turn all of them off if you want just the entry and the stop.
Do these work on a short the same way?
Yes, mirrored. Short Position seeds the stop above the entry and the target below, with P&L positive as price falls. Short Position (ATR) puts the stop its ATR multiple above the entry and the rungs below it. Alt+S places the classic short; the ATR variants have no shortcut and are picked from the Positions flyout.
Decide before you click
The value of a position tool is not the drawing. It is that you cannot place one without having already answered where you are wrong. Open the Positions flyout on any Crodl terminal chart, press Alt+L on the setup you are watching, and drag the stop to the level that would invalidate it. The quantity on the card is then the size that trade deserves — decided before the candle that makes you argue with yourself.
This article is for educational purposes only and is not financial advice. Leveraged trading carries substantial risk of loss. Always do your own research and never risk more than you can afford to lose.

Ready to automate your trading?
Connect your exchange, set up automations, and start trading smarter — all from one platform.
Start Trading Free