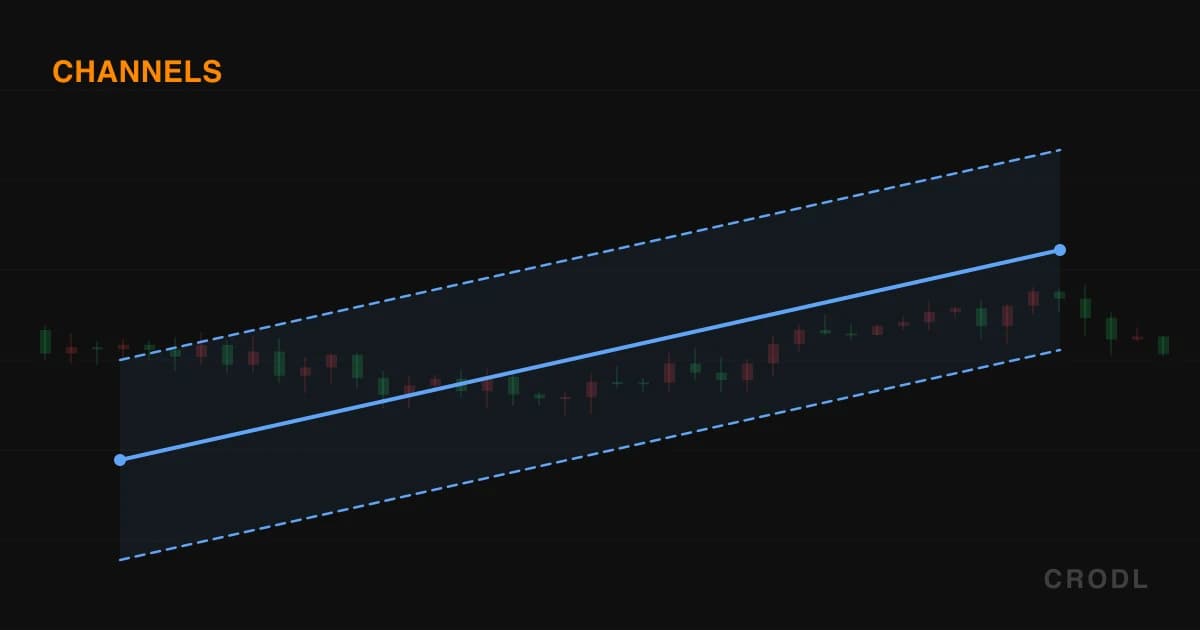
Channel Drawing Tools: Five Ways to Frame a Trend
The five channel tools on the Crodl chart — parallel, ATR, regression, flat top/bottom and disjoint — what each one measures, and when to reach for which.
A trend line gives you one edge. A channel gives you both — and the second line is what turns a level into a plan, because it tells you where the move is finished, not just where it started.
The Crodl chart ships five channel tools. All of them draw two lines and tint the space between; what separates them is what defines the second rail — your own hand, the market's volatility, a regression, a horizontal price, or nothing at all. They live in the Channels flyout, opened with the caret next to the channel button on the drawing toolbar down the left edge of the chart. Only two have shortcuts: Alt+P for the parallel channel, Alt+G for the regression channel.
| Tool | Clicks | What sets the second rail |
|---|---|---|
| Parallel channel (Alt+P) | 3 | Your third click |
| ATR Channel | 2 | ±(multiplier × ATR14) in price |
| Regression channel (Alt+G) | 2 | ±Nσ of closes around the fit |
| Flat Top/Bottom | 3 | A horizontal price |
| Disjoint channel | 4 | A second, independent segment |
Parallel channel: draw the frame yourself
Three clicks. The first two set the trend line — two swing lows for an ascending channel, two swing highs for a descending one. The third places the parallel anchor anywhere you like, and the vertical offset between it and the trend line's end point is applied to both endpoints, producing a rail that runs exactly parallel. The space between shades with a tint that deepens on selection.
Three drag handles — two on the trend line, one on the parallel anchor — adjust slope and width independently: find the slope from the touches that define it, then push the third anchor out to the extreme that overshot. Selected, price pills appear on both trend-line endpoints, plus a ↕ width pill at the midpoint reading the price distance between the rails.
Reach for this when you can already see the structure and want it drawn your way — a rising channel, a bear flag, a sloped range. If you'd rather have the shape found for you, Auto Channel is the indicator sibling.
ATR Channel: rails sized by the market's own volatility
The newest tool in the family, and the only two-click channel that still gives you both walls. You draw a trend line — that's it. The tool measures ATR(14) at the candle under the rightmost anchor and places guides at ±(multiplier × ATR) above and below, at both ends of your line.
The ATR is measured where the line lands, not where it started. The rightmost anchor is the reference bar, so the sleeve reflects current volatility, not the volatility of whatever swing you anchored to weeks ago. It's Wilder's RMA smoothing, count-seeded over the 120 bars trailing that anchor; on a young chart with fewer than 14 usable bars in the window it falls back to the mean of what it has.
The offsets live in price space, not pixel space. Each guide endpoint is re-projected through the price scale, so the channel stays a true ±ATR distance on a logarithmic axis instead of a rough approximation.
It degrades gracefully. If candle data isn't reachable for the anchor's window there's no ATR to offset by, the guides are skipped, and you're left with an ordinary trend line.
Its per-drawing options live in the drawing context bar that appears when the channel is selected. In the settings popover:
- ATR × — the offset multiplier, default 1, accepted between 0.1 and 10.
- Upper line / Lower line — per-side toggles, both on by default. Turn one off when only one side matters: a rising support line with a single 2×ATR ceiling is a cleaner take-profit map than a full sleeve.
- Extend left / Extend right — both off by default. Turning one on pushes the trend line and its guides out to the plot edge, which is how you carry a channel forward into empty space.
Selected, price pills mark both anchors and a midpoint pill reads ±1×ATR alongside the price that multiplier resolves to — the sleeve's width in dollars, not just in ATRs. Clicking any of the three lines selects the drawing; handles stay on your two anchors.
Reach for this when you want a trend line plus an honest tolerance band. A bare trend line forces a binary judgment on every wick; ±1×ATR turns "did it break?" into "did it break by more than a bar's worth of normal movement?" For invalidation and stop placement, that distinction is most of the edge. (What ATR measures, if it's new to you.)
Regression channel: the trend's statistical center
Two clicks pick a range, and the tool runs an ordinary least-squares regression on the closing prices of every candle between the anchors. You get a solid center line — the best-fit path of the trend — plus dashed upper and lower bands at ±Nσ of the residuals around that fit, with a tint between.
The σ width multiplier sits in the settings popover, defaults to 2, and is accepted between 0.5 and 4. At 2σ the bands contain most of the trend's closes by construction, making the outer band a natural stretch marker and the center line a reversion target. Selected, you get pills on the center line's endpoints and a ±2σ pill at the midpoint showing the band offset in price.
Reach for it when you don't trust your own eye — when a trend is choppy enough that two traders would draw two different channels. If the anchors span fewer than two bars, or candle data isn't reachable, it degrades to a plain segment with no bands at all.
Flat Top/Bottom: one wall that doesn't move
Three clicks: two for a sloping baseline, and a third that sets the price of a horizontal second edge spanning the same range. That's the ascending triangle — rising lows, flat resistance — and its descending mirror, drawn as what they are: a slope pressing into a level. Selected, pills mark the baseline endpoints plus the flat edge's price at its midpoint, which is the number that matters since the flat side is where the break happens.
Disjoint channel: when the walls aren't parallel
Four clicks, two per edge, and the edges are fully independent — they can converge, diverge, or cross. This is the tool for broadening formations, contracting wedges, and megaphone structures a parallel channel cannot express. All four endpoints get handles and price pills when selected.
Styling and shared controls
The context bar carries color, line style and width; its popover adds Visible and Labels toggles — Labels off keeps the geometry and hides every pill. Save as default stores the current styling as the template for future drawings of that kind. Defaults: blue 1.6px for the parallel, ATR, flat and disjoint channels, orange 1.4px for the regression.
Honest limitations
The ATR Channel measures volatility at one bar — the rightmost anchor — and applies that width along the whole line. It's a constant-width sleeve, not a breathing envelope; drag the right anchor into a calmer stretch and the sleeve narrows for the entire drawing. For per-bar adaptive width you want Keltner Channels or ATR Bands.
The regression channel fits closes only, so a range full of long wicks produces bands that don't contain its own extremes — correct behavior, but don't read them as a high/low envelope. When the right anchor sits on the newest bar, the fit updates as that bar develops.
For the parallel, flat and disjoint channels, the second rail is offset in screen space. That keeps them visually parallel at all times, but on a logarithmic axis a constant pixel gap is a constant ratio, not a constant price distance. The ATR Channel is the exception — its offsets are true price offsets.
None of these fire alerts. A sloped rail's price changes every bar and the alert engine takes a fixed number; the closest you get is the chart's right-click Add alert at $X, a static price alert at the price under your cursor.
Frequently Asked Questions
Which channel should I default to?
The parallel channel for structure you can already see, the ATR Channel when you want a trend line with a tolerance band, and the regression channel for trends messy enough that your own drawing feels arbitrary.
Does the ATR Channel change width as I pan or zoom?
No. The ATR is measured at the bar under the rightmost anchor, so panning and zooming leave it alone. It changes only if you move an anchor, edit the multiplier, or new candles change the ATR at that reference bar.
Why does my regression channel only show one line?
That's the fallback path: fewer than two candles in the selected range, or candle data that isn't reachable. Drag the anchors wider apart, or scroll so the range's history loads, and the ±Nσ bands appear.
Can I show only the upper half of an ATR Channel?
Yes — the popover's Upper line and Lower line toggles are independent and both on by default. A support line with a single overhead guide as the target is a common setup.
Frame the trade, not just the line
All five are in the Channels flyout on every Crodl terminal chart. Press Alt+P for the classic, or pick the ATR Channel and let the market decide how wide "wrong" has to be before you're actually wrong.
This article is for educational purposes only and is not financial advice. Leveraged trading carries substantial risk of loss. Always do your own research and never risk more than you can afford to lose.

Ready to automate your trading?
Connect your exchange, set up automations, and start trading smarter — all from one platform.
Start Trading Free