Fibonacci & Gann Drawing Tools on the Crodl Chart
Crodl's eight Fibonacci and Gann drawing tools — retracement, extension, channel, fan, circles, time zones, Gann fan and box — and their exact level sets.
Ratio tools are the oldest family on any chart: you pick two points, the tool divides the space between them, and you get a grid to trade against. Retracements, extensions, fans, circles, boxes, time projections — all variations on that idea, applied to price, to time, or to both.
The Crodl chart ships eight of them in one flyout. Open the drawing toolbar down the left edge, click the Fib & Gann group, and you get six Fibonacci tools and two Gann tools. Two have shortcuts — Alt+F for the retracement, Alt+X for the extension — and the rest are one click away. Here is what each one actually draws.
The Fibonacci tools
All six are anchor-driven: place the points and the geometry stays glued to them.
Fibonacci retracement (Alt+F)
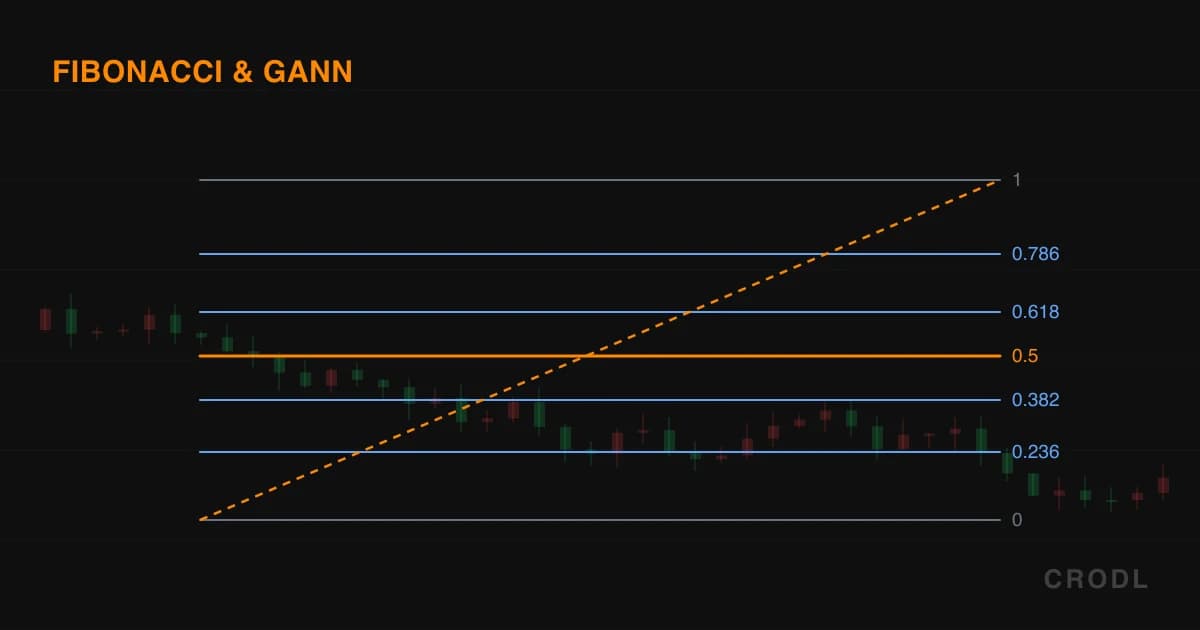
Two clicks — one at each end of the swing you want to measure. Seven horizontal levels land across the range:
0, 0.236, 0.382, 0.5, 0.618, 0.786, 1
Faint alternating tints fill the gaps so the levels read as zones. Each carries its ratio at the left end and its ratio plus the price at the right, and selecting the drawing adds a price pill at each anchor.
One mechanic to know: 0 is always pinned to the higher of the two anchor prices and 1 to the lower, whichever end you clicked first — the tool reads price, not click order. The levels also span only the bar range between your anchors; they do not run to the right edge the way the extension's do.
Prefer not to make the anchoring call? The Auto Fibonacci indicator keeps the same grid across a rolling high–low window instead.
Fib Extension (Alt+X)
Three clicks: the start of the impulse leg, the end of it, then the pullback point you want to project from. Nine levels:
0, 0.382, 0.618, 1, 1.272, 1.414, 1.618, 2, 2.618
A thin line connects the three anchors so the structure stays visible, and the levels run from the third anchor to the right edge of the plot — into space price has not reached yet. Direction is signed from the first-to-second leg, so it works for longs and shorts with nothing to flip. Level 0 sits on your third anchor; level 1 is a full repeat of the measured leg from it.
Fib Channel
Three clicks — two to lay the baseline along a trend, one to set the channel width. Instead of a single parallel edge, you get seven parallel lines at fractions of that offset:
0, 0.25, 0.382, 0.5, 0.618, 0.75, 1
Each line carries its fraction at the right end, with very faint fills between them. It is the retracement grid rotated onto a slope — useful when a trend respects internal structure, not just its outer rails. The Auto Channel indicator is the hands-off counterpart.
Fib Fan
Two clicks — an origin and a trend reference point. The tool fires six rays from the origin at Fibonacci fractions of the trend's vertical displacement:
0.236, 0.382, 0.5, 0.618, 0.786, 1
The 1.0 ray is the trendline through both anchors and renders at full strength; the shallower rays sit dimmer beneath it. All six extend to the right edge of the plot and label themselves when selected. Losing the 0.618 ray while holding the 0.5 is deceleration, not a break.
Fib Circles
Two clicks — a center and a radius reference. Seven concentric rings scale the base radius by:
0.236, 0.382, 0.5, 0.618, 0.786, 1, 1.618
The 1.0 ring passes through your second anchor and is emphasized; the rest render at reduced opacity. Radii are taken per axis, so the rings are ellipses following the chart's current aspect — measuring distance from your anchor in price and time at once, which is both the tool's claim and the reason it is the most speculative here.
Fib Time Zones
Two clicks define a base interval in bars, then vertical lines land at Fibonacci sequence multiples of it:
0, 1, 2, 3, 5, 8, 13, 21, 34
These are sequence terms, not ratios — the one tool in the family with nothing to do with 0.618. The lines span the price pane, the 0 line is emphasized, and projections extend into whitespace beyond the last candle; because 34 units out can land thousands of bars away, lines well past the right edge are dropped rather than drawn. Pair it with Swing Highs and Lows to mark the pivots you measure between.
Editing the level set
The retracement and extension have an editable level table; the other four Fibonacci tools use fixed sets. Select the drawing, open its settings popover, and the Levels row gives one numeric input per level with an × to remove it, plus + Add level.
Every commit is normalised: anything outside −5 to 5 is discarded, duplicates dropped, the rest sorted ascending. Clear the table and the drawing falls back to the stock set. Negative levels are legal and useful — a −0.272 on a retracement projects below the swing low, where stop runs live. Level sets are per drawing: Save as default stores color, width and line style, not your levels.
The Gann tools
W.D. Gann's premise was that price and time move in fixed proportions and that the angles worth watching are simple ratios. Both tools implement that geometry faithfully; whether the premise holds is a separate question, taken up below.
Gann Fan
Two clicks — an origin and a 1/1 reference point. Nine rays radiate from the origin at the classic ratios:
8/1, 4/1, 3/1, 2/1, 1/1, 1/2, 1/3, 1/4, 1/8
The 1/1 ray runs through both anchors at full strength; the eight others render dimmer. All extend to the right edge and label themselves when selected. Traditional reading: above the 1/1 is strong, and sliding from the 2/1 down to the 1/2 is a trend losing a gear at a time.
Gann Box
Two clicks for the two corners. The box fills with a translucent tint and divides itself internally:
- Price levels at 0.25, 0.382, 0.5, 0.618, 0.75 of the box height, measured up from the bottom edge, the 0.5 midline slightly stronger, each fraction labelled at the right edge
- Time divisions at 0.25, 0.5, 0.75 of the box width
That mix of Gann quarters and Fibonacci thirds is deliberate and matches the standard implementation. Draw the box around a completed swing and it shows where price and elapsed time sit inside that move at once. The divisions are fixed — no level table for this one.
Anchoring, style and persistence
All eight inherit the drawing system's behavior. Press M for magnet mode and anchors snap to the nearest open, high, low or close of the candle under your pointer, which is the difference between a retracement anchored to the wick and one anchored wherever you happened to click.
Each drawing carries its own color, width and line style, a Labels toggle that hides every ratio and price readout while keeping the geometry, and a Visible toggle that hides it without deleting it. Drawings persist per chart and per pane across reloads, and because each anchor stores its candle's timestamp, they re-attach to the same moment when you switch timeframes.
Honest limitations
The big one first: none of these levels are laws. Fibonacci ratios work partly because a great many traders watch the same numbers and place orders around them — real reflexivity, but not physics, and the same swing anchored two bars differently gives a different grid. Gann is more contested still: his angle ratios depend on the chart's price and time scaling, so a 1/1 line means something different at every zoom level. Our implementation, like every mainstream one, derives the rays in pixel space from your anchors — the fan stays glued to your data, but its character shifts as you rescale. Treat a method that needs a particular scaling as a way of organizing attention, not as a prediction.
One concrete quirk: the retracement's 0 sits at the higher anchor price rather than following click direction, so on a down move the numbering reads inverted from the convention that anchors 0 at the swing low — a bounce to 61.8% of a down leg shows on the grid as 0.382. Read the ratios as fractions measured down from the high and it is unambiguous.
Frequently Asked Questions
Which Fibonacci tool should I start with?
The retracement, and probably only the retracement. It answers the most common question — how deep is this pullback — with the least ambiguity. Add the extension when you need targets past the previous high. The rest are for traders who already have a reason to want them.
Can I change the default levels for every new fib I draw?
Not the levels — those are per drawing. Save as default persists color, width and line style, so new drawings adopt your styling but start from the stock level set.
Do these tools repaint or move on their own?
No. They are drawings, not indicators: they sit where you anchored them and move only when you move them. Geometry recomputes as you pan, zoom or change timeframe, but the anchors never change themselves. For levels that do update as the market moves, use Auto Fibonacci or the visible-range support and resistance study.
Is Gann worth using at all?
Depends what you expect from it. As a prediction engine the evidence is thin and the scale dependence is a real methodological problem. As a way of framing a trend — reference slopes that make deceleration visible, a box that splits a swing into quarters of price and time — plenty of experienced traders find it useful. Both tools are here so you can judge for yourself.
Draw the level, then let the market vote
The whole family is one flyout away on every Crodl terminal chart. Press Alt+F, anchor the swing that matters, and see whether the market treats your levels as real.
This article is for educational purposes only and is not financial advice. Leveraged trading carries substantial risk of loss. Always do your own research and never risk more than you can afford to lose.

Ready to automate your trading?
Connect your exchange, set up automations, and start trading smarter — all from one platform.
Start Trading Free