
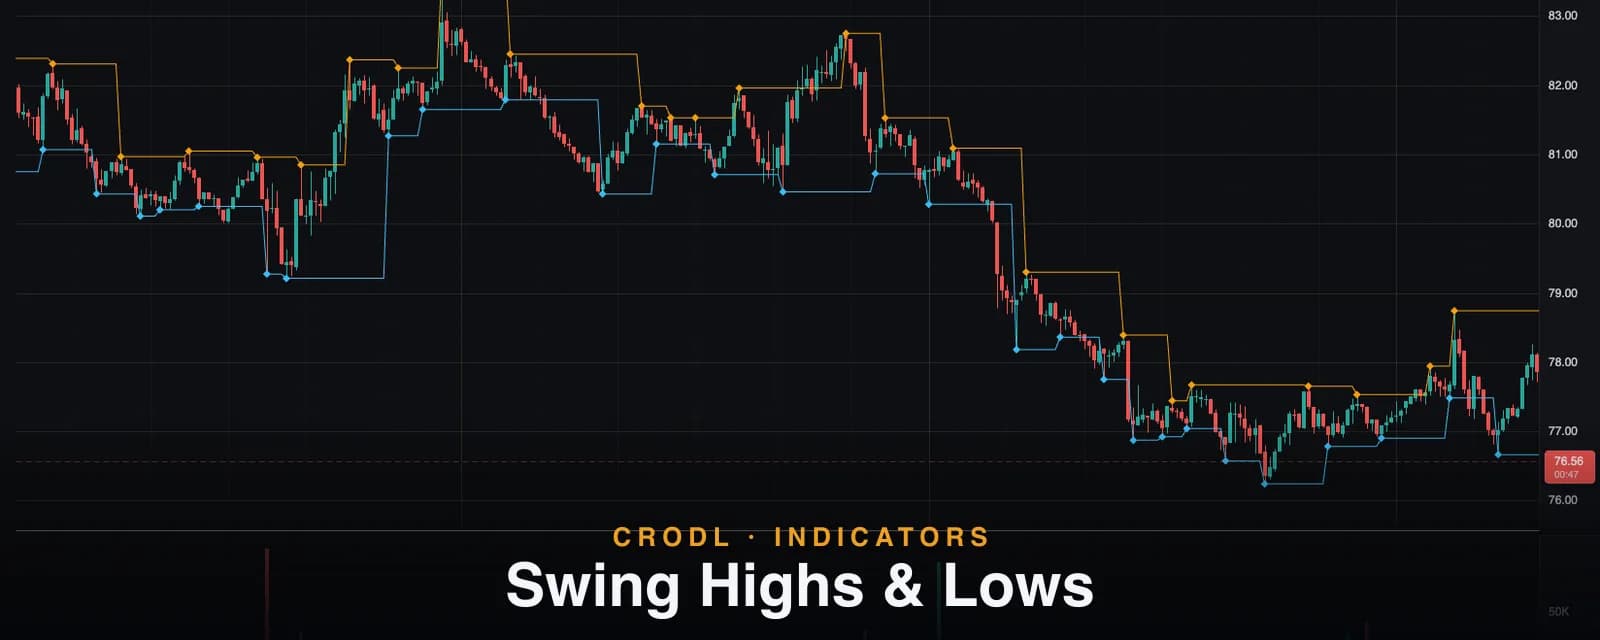
Swing Highs & Lows
Map market structure automatically: Crodl's Swing HL study marks confirmed swing highs and lows and tracks the last pivot levels for entries and stops.
Every market-structure concept you have ever read — higher highs, break of structure, liquidity resting under the lows — starts from the same primitive: the swing pivot. A swing high is a bar whose high stands above its neighbors; a swing low mirrors it below. Simple, but marking them by hand is slow, and marking them by eye is inconsistent — the two failure modes that quietly ruin structure-based trading.
The Swing HL study on the Crodl terminal does it mechanically. It marks every confirmed swing high and swing low with a diamond on the chart, and draws two carry-forward lines that always show the most recent confirmed pivot levels — the exact prices structure traders watch for breaks, retests, and stop placement.
One input, two lines, zero discretion. Here is how it works and how to trade it.
What it shows
Swing HL plots four things on the price pane:
- Swing high markers — amber diamonds at each confirmed swing high.
- Swing low markers — sky-blue diamonds at each confirmed swing low.
- Last swing high line — a stepped line holding the most recent confirmed swing high price until a new one confirms.
- Last swing low line — the same for swing lows.
The two lines are the practical payoff: at any bar, they show the exact levels that define current structure. Price closing above the last swing high line is a mechanical break of structure; the last swing low line is where longs logically place stops.
How it works on the Crodl terminal
Add Swing HL from the indicator picker. The study has exactly one input — Pivot strength (default 3, range 1 to 50) — and the rule is strict:
A bar is a swing high when its high is strictly greater than the highs of the Pivot strength bars on each side. Exact ties disqualify — two equal highs produce no pivot, which keeps double-tops from printing two conflicting markers. Swing lows mirror the rule on the lows.
Two mechanical details worth knowing:
- Confirmation lag is structural. A pivot needs
Pivot strengthbars to its right before it can confirm, so a marker appears that many bars after the pivot bar. This is not a flaw — it is what makes the study non-repainting. Once a diamond prints, it never moves and never disappears. - Gaps reset the lines. The carry-forward lines only run across verified, complete candles. Across a data gap the lines break rather than carry a stale level forward — you will never lean on a swing level the market data cannot actually support.
Colors, line width, and marker visibility for all four elements are editable in the study's Style tab.
| Pivot strength | Pivot character | Typical use |
|---|---|---|
| 1–2 | Every minor wiggle | Scalping micro-structure, noisy |
| 3–5 (default 3) | Intraday swings | Break-of-structure entries, day trading |
| 8–15 | Significant swings | Swing trading, stop placement |
| 20+ | Major turning points | Position context, macro structure |
How traders actually use it
Mechanical break of structure
The last swing high line is a standing breakout trigger: a close above it in an uptrend confirms continuation; a close below the last swing low warns the trend is failing. Because the levels are computed, not eyeballed, the signal is the same every time — a prerequisite for actually reviewing your own trading.
Stops beyond the pivot, not at it
Swing lows are where stop-loss clusters live, which is precisely why price wicks through them — the Liquidation Levels indicator exists to map that exact behavior. Use the last swing low line as the reference, then place the stop beyond it with buffer, so the routine pivot sweep does not take you out of a correct trade.
Trail pivot to pivot
In a trend, ratchet your stop under each newly confirmed swing low (for longs) as the line steps up. You stay in for the body of the move and exit mechanically when structure actually breaks — no target-guessing required. Pivots that form at a high-volume node or a mapped S/R level deserve extra respect as trailing anchors.
Frequently Asked Questions
Does it repaint?
No. A pivot confirms only after Pivot strength bars close on both sides; from that moment the marker and the level are fixed. The cost is the confirmation delay — there is no way to know a high is a swing high until the market prints lower highs after it.
Why did a marker appear several bars behind price?
That is the confirmation lag working as designed. With the default Pivot strength of 3, a swing high confirms 3 bars after the pivot bar. Raise the setting and markers confirm later but mark more significant turns.
What is the difference between the markers and the lines?
Markers show every confirmed pivot in history. The two lines show only the most recent confirmed high and low — the levels that define structure right now — and step to each new pivot as it confirms.
Which Pivot strength should I use?
Match it to your holding period: the default 3 suits intraday structure, 8–15 suits swing trading, 20+ marks the turns you would label on a weekly chart. There is no best value — only a best value for your timeframe.
Put your structure on autopilot
Swing HL is available on every Crodl terminal chart — add it from the indicator picker and your swing highs, swing lows, and current structure levels are marked mechanically on every symbol and timeframe, alongside live trading on six exchanges.
This article is for educational purposes only and is not financial advice. Leveraged trading carries substantial risk of loss. Always do your own research and never risk more than you can afford to lose.

Ready to automate your trading?
Connect your exchange, set up automations, and start trading smarter — all from one platform.
Start Trading Free