
Auto Fibonacci
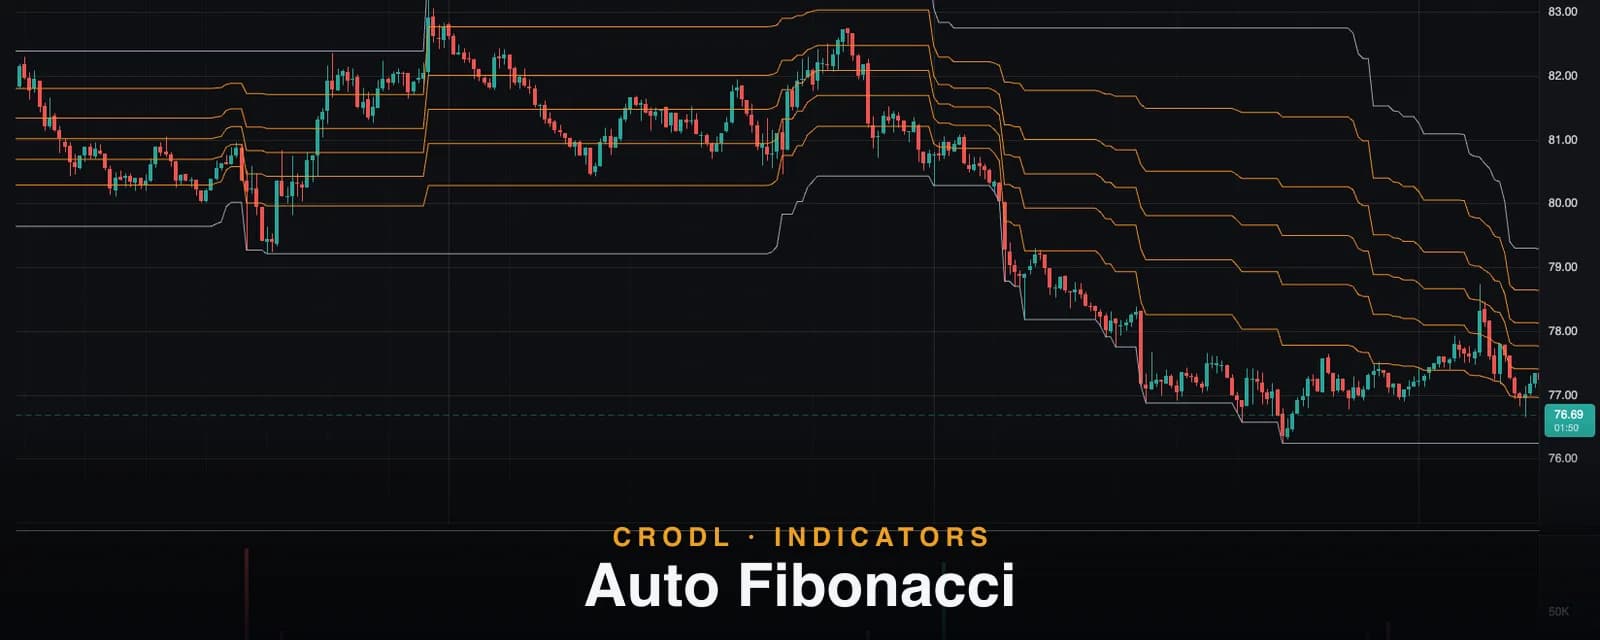
Crodl's Auto Fibonacci indicator maintains a live retracement grid — 23.6% to 78.6% — across the rolling N-bar high–low range, so your fib levels are never stale.
The Fibonacci retracement is probably the most-drawn tool in technical analysis — and one of the most inconsistently drawn. Two traders anchoring the same move will pick different swing points, and the levels drift out of date the moment price makes a new extreme. The tool is objective; the anchoring is not.
The Auto Fibonacci preset on the Crodl terminal removes both problems by anchoring for you: it takes the highest high and lowest low of the last N bars and lays the full retracement grid across that range, recalculating live as the window rolls forward. No anchoring decisions, no stale levels, no forgetting to redraw after a breakout. This post covers what the ratios mean, exactly how our implementation computes the grid, and the ways traders put it to work.
What Auto Fibonacci shows
Fibonacci retracement levels are horizontal lines placed at fixed ratios of a price range. The ratios come from relationships in the Fibonacci sequence — 0.618 is the golden ratio, 0.382 is its complement, 0.236 a deeper derivative, and 0.786 the square root of 0.618. The premise: after a strong move, pullbacks tend to pause or reverse at consistent fractions of that move rather than at random depths. Whether that's market geometry or a self-fulfilling prophecy from millions of traders watching the same lines, the levels get respected often enough to organize a trade plan around.
The Auto Fibonacci grid spans the full high–low range of the lookback window, with 0% pinned to the range low and 100% to the range high:
| Level | Position in the range | Typical role |
|---|---|---|
| 0% | Rolling low | Range floor — bull invalidation point |
| 23.6% | Just above the low | Shallow support in weak ranges |
| 38.2% | Lower third | First serious retracement zone |
| 50% | Midpoint | Equilibrium — not a true fib ratio, but universally watched |
| 61.8% | Golden ratio | The classic "last defense" level |
| 78.6% | Deep in the range | Sweep zone before a full retest |
| 100% | Rolling high | Range ceiling — bear invalidation point |
How it works on the Crodl terminal
The preset is a Rune script (autoFib, listed as "Auto Fib (range)") rendered as an overlay on the price pane. It has deliberately few settings:
- Lookback — default 100 bars (range 5–1000). This is the window the grid spans.
- Line Color — default orange, applied to the five interior levels.
Each bar, the script takes the highest high and lowest low over the lookback window, computes the range, and draws seven lines: the low (0%), the high (100%), and five interior levels at low + range × ratio for 0.236, 0.382, 0.5, 0.618, and 0.786. The 0% and 100% boundary lines render in muted gray so the tradeable interior levels stand out in the accent color, and every line carries a live price label on the axis so you can read exact values without a crosshair.
One mechanic to understand well: the grid is a rolling range, not a pivot-anchored retracement. When a new extreme prints — or an old extreme ages out of the 100-bar window — the whole grid re-derives from the new high–low range. Nothing is repainted into history; the levels simply track the current window, which is exactly what keeps them from going stale. If you want levels frozen to one specific impulse leg, Crodl's manual fib drawing tool does that; Auto Fibonacci answers a different question — where does price sit inside the range that matters right now?
The preset draws no alerts of its own, so traders typically pair it with an alert-capable oscillator for triggers at the levels.
How traders use it
Buying pullbacks in a trend
In an uptrend, the workhorse zone is 38.2%–61.8%: strong trends tend to hold the shallower levels, while the 61.8% retracement is the classic last-defense entry before the trend is in question. A common playbook is to wait for price to enter the zone, then demand a confirmation trigger — a bullish Stochastic cross or an RSI reclaim of 50 — before committing, with invalidation below the next level down.
Fading the edges of a range
When the market is ranging rather than trending, the 0% and 100% boundaries are the trade. Sweeps through 78.6% or 23.6% that snap back quickly are classic deviation setups: the range edge got run for liquidity, and the failure to continue is the signal. The 50% midpoint then serves as the natural first target.
Confluence stacking
A fib level alone is a decent line; a fib level that lands on independent structure is a real level. The setups traders weight most heavily are ones where 61.8% coincides with the Ichimoku Kijun or cloud edge, or where a deep retracement into 78.6% prints bullish divergence on the oscillator. Because Auto Fibonacci recalculates continuously, these confluences appear and dissolve in real time — no manual redrawing required.
Frequently Asked Questions
What lookback should I use?
Match it to the structure you trade. The default 100 bars captures the dominant swing on most timeframes; scalpers often drop to 30–50 so the grid tracks intraday ranges, while swing traders stretch to 200–500 to span the macro range. If your levels feel like noise, your window is too short; if price never reaches them, it's too long.
Why did all my levels jump at once?
The window rolled. Either price printed a new high or low (expanding the range) or the previous extreme fell out of the lookback window (contracting it). Every level is derived from the same high–low pair, so when one boundary moves, the whole grid rescales. That's the intended behavior of a rolling-range tool.
Is 50% really a Fibonacci level?
No — it comes from Dow-theory tradition, not the Fibonacci sequence. It's included because half-back is one of the most-watched retracement depths in practice, and a grid without it would ignore a level the market demonstrably reacts to.
Does Auto Fibonacci repaint?
Confirmed bars never change: each bar's levels are computed from completed highs and lows in its window. The current grid shifts as the window rolls — that's the "auto" part — but past values aren't rewritten, and there are no signals to un-print.
Levels that keep themselves honest
Auto Fibonacci is available on every Crodl terminal chart — add it from the indicator picker, set the lookback to your trading horizon, and the retracement grid maintains itself while you focus on execution across six connected exchanges.
This article is for educational purposes only and is not financial advice. Leveraged trading carries substantial risk of loss. Always do your own research and never risk more than you can afford to lose.

Ready to automate your trading?
Connect your exchange, set up automations, and start trading smarter — all from one platform.
Start Trading Free