
Ichimoku Cloud
How Crodl's Ichimoku Cloud preset computes Tenkan, Kijun, the Senkou spans, and the Chikou line — why its cloud is un-displaced, and how traders trade it.
Most indicators answer one question. Is the market trending? Is momentum rising? Is price stretched? Ichimoku Kinko Hyo — usually translated as "one-glance equilibrium chart" — was built by the Japanese journalist Goichi Hosoda to answer all of them at once. He spent roughly three decades refining it before publishing in 1969, and the result is a five-line system that shows trend direction, momentum, and support/resistance in a single look.
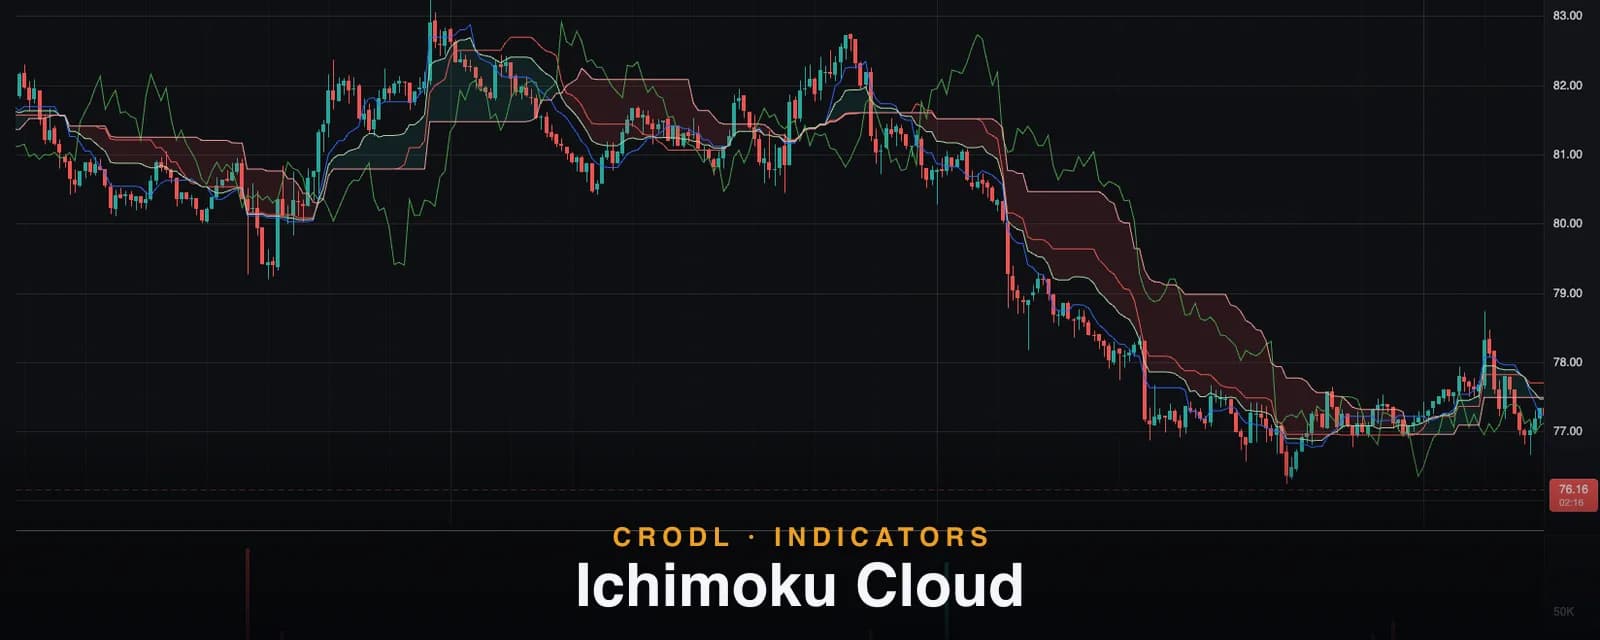
The Ichimoku Cloud preset on the Crodl terminal draws the full system as an overlay on your candles: Tenkan-sen, Kijun-sen, both Senkou spans with a color-coded cloud fill between them, and the Chikou span. This post covers the classic theory briefly, then gets specific about how our implementation computes each line — including one honest difference from the textbook version that you should know before you trade with it.
What the Ichimoku Cloud shows
The core idea that separates Ichimoku from a stack of moving averages: every Ichimoku line is a midpoint of a high–low range, not an average of closes. The midpoint of the last N bars' range is where price sits relative to everything the market has actually traded — Hosoda's notion of equilibrium. When price is above a midpoint, buyers have controlled that window; below it, sellers have.
Five lines come out of that one idea:
| Line | Default length | Construction | Reads as |
|---|---|---|---|
| Tenkan-sen | 9 | Midpoint of the 9-bar high–low range | Short-term equilibrium, the trigger line |
| Kijun-sen | 26 | Midpoint of the 26-bar range | Medium-term equilibrium, the baseline |
| Senkou Span A | — | Midpoint of Tenkan and Kijun | Fast edge of the cloud |
| Senkou Span B | 52 | Midpoint of the 52-bar range | Slow edge of the cloud |
| Chikou Span | 26 | Close from 26 bars ago | Momentum versus past price |
The cloud (kumo) is the shaded area between Senkou A and Senkou B. When Span A is above Span B, the faster equilibrium sits above the slower one — a bullish structure, filled teal. When A drops below B, the fill flips to red. The cloud's thickness matters too: a fat cloud represents a wide band of prior trading and acts as heavier support or resistance than a thin one.
How it works on the Crodl terminal
The preset is a Rune script (ichimokuCloud) rendered directly on the price pane. Four lengths are configurable in the settings dialog:
- Tenkan Length — default 9 (range 1–200)
- Kijun Length — default 26 (range 1–200)
- Senkou B Length — default 52 (range 1–400)
- Chikou Offset — default 26 (range 1–200)
The math is the classic construction, computed per bar: Tenkan is (highest high + lowest low) / 2 over the Tenkan length, Kijun is the same midpoint over the Kijun length, Senkou A is the average of Tenkan and Kijun, and Senkou B is the midpoint over the Senkou B length. Tenkan draws in blue, Kijun in red, Chikou in green, and the spans in pale green and pale red, with the cloud filled at low opacity so your candles stay readable. The fill logic is segment-aware — on the bar where the spans cross, both segments include the crossover bar, so the twist renders cleanly instead of leaving a gap.
An honest note: the cloud is un-displaced
Textbook Ichimoku plots Senkou A and B shifted 26 bars into the future, so the cloud floats ahead of price. The Rune dialect that powers Crodl presets has no forward-offset plotting, so — as the preset's own source notes — Senkou A and B are drawn un-displaced, on the bars that produced them, rather than 26 bars ahead.
Practically, this changes two things. First, you won't see a cloud projected past the last candle. Second, "price versus cloud" tests happen against the current spans rather than spans computed 26 bars ago — which makes the cloud more responsive to recent structure than the displaced original. Some traders prefer this; either way, you should know which version you're reading.
The Chikou span is handled differently: it's drawn as the close from 26 bars ago plotted on the current bar. That's the same close-versus-past-price comparison the classic lagging span makes — just anchored at the live bar instead of 26 bars back, so the signal (current close above or below where price traded 26 bars ago) is read at the right edge of the chart.
How traders use it
The cloud as a trend filter
The simplest and most robust use: price above a teal cloud is an uptrend, price below a red cloud is a downtrend, and price inside the cloud is contested ground where most traders stand aside. Because the cloud is a zone rather than a line, it filters out the single-line whipsaws that plague moving-average systems. Thick cloud below price = strong support shelf; thin cloud = easily pierced.
TK crosses
The Tenkan crossing the Kijun is Ichimoku's trigger signal, and its quality is graded by location. A bullish TK cross above the cloud is a strong continuation signal; the same cross below the cloud is weak and counter-trend. Many traders demand a momentum confirmation before acting — a MACD crossover or zero-line agreement pairs naturally here.
Kijun pullbacks and the cloud twist
In a trending market the Kijun acts like a magnet and a launchpad: price stretches away, snaps back to the baseline, and resumes. Buying the Kijun tag in an uptrend — ideally where it stacks with an Auto Fibonacci retracement level — is a classic continuation entry. Meanwhile the cloud twist (Senkou A crossing Senkou B) flags a potential regime change; combined with RSI reclaiming or losing its 50 line, it's an early warning that the trend filter is about to flip.
Frequently Asked Questions
Why doesn't my cloud extend past the last candle?
By design. The Rune engine has no forward-displacement plotting, so the spans render on the bars that produced them instead of 26 bars ahead. The values are identical to the classic calculation — only the horizontal placement differs. The preset's source documents this directly.
Do the default 9 / 26 / 52 settings make sense for crypto?
Those numbers come from Japan's old six-day trading week: 9 was a week and a half, 26 a month, 52 two months. Crypto trades 24/7, so some traders double to 20/60/120 for a comparable calendar span. That said, 9/26/52 is what the majority of market participants watch, and levels work partly because they're watched. All four lengths are editable in the preset settings.
Does the Ichimoku Cloud repaint?
No. Every line is a midpoint of completed highs and lows, and the Chikou is a backward lookup. The forming candle updates its values until it closes — standard for any live indicator — but confirmed bars never change, and nothing is redrawn into the past.
Is Ichimoku enough on its own?
Hosoda designed it as a complete system, and the five lines do cover trend, momentum, and support/resistance. But all five are derived from the same price series, so they can agree and still be wrong together. Most traders pair the cloud with an independent momentum read and volume context rather than trading it in isolation.
Put the cloud on your chart
The Ichimoku Cloud preset is one click away on every Crodl terminal chart — add it from the indicator picker, tune the lengths to your timeframe, and you get Hosoda's full five-line system rendered live, alongside trading on six exchanges.
This article is for educational purposes only and is not financial advice. Leveraged trading carries substantial risk of loss. Always do your own research and never risk more than you can afford to lose.

Ready to automate your trading?
Connect your exchange, set up automations, and start trading smarter — all from one platform.
Start Trading Free