Harmonic Pattern Tools: Drawing XABCD, ABCD and Three Drives
Draw harmonic structures by hand on the Crodl chart: five-click XABCD, four-click ABCD with a live CD:AB ratio readout, and the seven-click Three Drives.
Harmonic patterns are the strictest idea in technical analysis: a shape only counts if its legs measure the right fractions of one another. A Gartley isn't a Gartley because it looks like one — it's a Gartley because B retraces 0.618 of the XA leg and D completes near 0.786 of it. The reward for that strictness is a price zone defined before price arrives: the D point, the potential reversal zone.
Crodl has three tools for putting those structures on the chart — XABCD Pattern, ABCD Pattern and Three Drives — in the Patterns flyout on the drawing toolbar down the left edge of the chart. They are manual tools: you click the pivots, the tool draws and maintains the structure. They do not scan for patterns, and with exactly one exception they do not measure your ratios for you.
How placement works
Each tool is a click-per-pivot sequence: pick it from the flyout, then drop one anchor per click in order. Between clicks the pattern previews at reduced opacity with the unplaced pivots collapsed onto the last one you set, so the live segment tracks your cursor; Escape abandons a half-placed pattern. The final click commits the drawing and selects it — which matters, because the pivot letters only render while a drawing is selected. Every vertex then carries a handle: drag one pivot to reshape a single leg, or grab any segment of the zigzag to shift the whole structure without changing its proportions.
Pivot precision is the whole game here, so magnet mode — the toolbar's magnet button, or the M key — is worth turning on: it snaps each anchor to the nearest open, high, low or close of the candle under your pointer, so X and A land exactly on the wick you meant.
The tools have no settings of their own; they inherit the shared drawing controls that appear on selection — colour, width, line style, a Labels checkbox, lock, duplicate and delete. All three default to amber at 1.4px solid. Anchors store a price and a timestamp, so patterns survive reloads and re-project onto the same moments in time when you switch timeframes.
The three tools
XABCD Pattern — five clicks
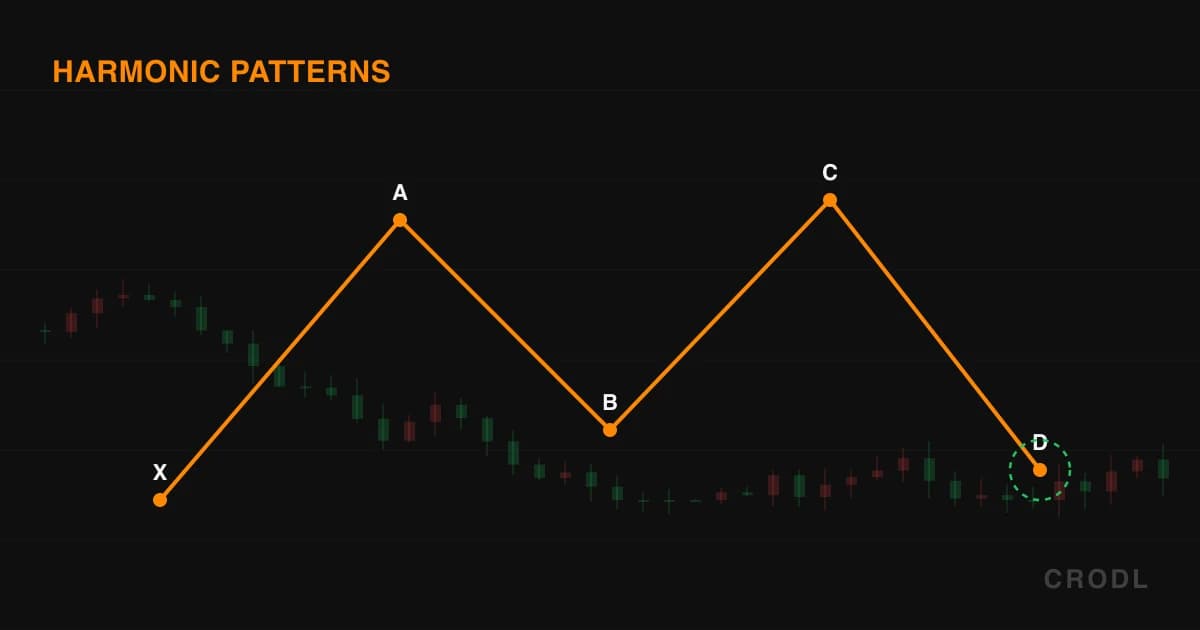
Clicks land as X (pattern origin), A (first reaction), B (the retracement of X→A), C (the retracement of A→B) and D (completion — the PRZ). The tool strokes the X→A→B→C→D zigzag and tints the two pattern lobes — the X-A-B and B-C-D triangles — with a translucent fill in the stroke colour. While selected, the letters X, A, B, C and D sit at each pivot, above local highs and below local lows so they stay clear of the lines.
That is the complete feature set, and the honest part matters: XABCD does not compute or display any retracement ratio. It gives you an editable, persistent five-point skeleton with the lobes shaded so the structure reads at a glance. Whether B really retraced 0.618 of XA is a measurement you make yourself.
This is the tool traders reach for when they want a named harmonic on the chart — Gartley, Bat, Butterfly, Crab. Those names are ratio definitions, not shapes:
| Pattern | B retracement of XA | D completion |
|---|---|---|
| Gartley | 0.618 | 0.786 of XA |
| Bat | 0.382–0.50 | 0.886 of XA |
| Butterfly | 0.786 | 1.272–1.618 of XA (beyond X) |
| Crab | 0.382–0.618 | 1.618 of XA (beyond X) |
Those are the conventional definitions from the harmonic literature. The tool enforces none of them — it draws whatever five points you click, with the same confident lettering either way.
ABCD Pattern — four clicks
Clicks land as A, B, C, D. The tool strokes the solid A→B→C→D zigzag, adds two dashed guides — A→C and B→D, the classic ABCD channel rails — and tints the A-B-C and B-C-D lobes. The rails are a fast symmetry check: in a textbook AB=CD they run roughly parallel.
This is the one tool in the set that prints a number. While selected, it renders the AB=CD leg ratio just right of the C pivot, to three decimals:
(C price − D price) / (A price − B price)
A raw price-difference ratio between the two impulse legs, taken from the anchors you placed: how far CD travelled relative to AB. 1.000 is the textbook AB=CD; 1.272 and 1.618 are the common extended variants; below 1.000 means CD fell short. The value is signed, so a properly alternating pattern reads positive and a negative number means your C or D anchor broke the zigzag. If A and B sit at exactly the same price, the ratio is omitted rather than printing an infinity.
Note what it is not: it ignores the BC retracement and time symmetry entirely, and makes no judgement about whether the ratio is close enough to a valid one.
Three Drives — seven clicks
Seven clicks, labelled in order 0, 1, A, 2, B, 3, C: an origin, then three successive drives with the corrections between and after them. The tool strokes one solid polyline through all seven pivots and, when selected, writes the labels. No lobe fills, no guide lines, no ratio readout — a clean seven-point skeleton.
It is an exhaustion structure: three consecutive pushes in the same direction, each conventionally extending 1.272 or 1.618 of the prior correction, with the corrections themselves roughly symmetric. By drive 3 the move has reached for an ever more extended objective three times, and that completion is where reversal traders look for the turn.
Measuring the ratios yourself
Since only ABCD prints a number, the ratio work happens with the fib tools in the neighbouring flyout. Fibonacci retracement (Alt+F) drawn from X to A gives you the 0.618 and 0.786 rails to test B and D against, and its level list is editable — add 0.886 for Bat setups or 1.13 for deeper completions. Fib extension (Alt+X) projects CD off the BC leg. That pairing turns a five-point sketch into a validated one.
Honest limitations
These tools draw; they do not judge. Nothing checks your ratios, nothing rejects a shape, and nothing warns you when a "Gartley" has a B point at 0.45. The lettered pivots and shaded lobes lend a structure visual authority its geometry may not have earned.
Harmonic trading is also genuinely contested. There is no accepted evidence that 0.786 is meaningfully different from 0.75 or 0.80, and every practitioner sets their own tolerance band. Widen it enough and almost any zigzag qualifies as something — the core criticism of the approach. Pivot choice compounds it: where X belongs depends on your timeframe and which wick you accept. Magnet mode makes your clicks consistent, not correct.
There is no automatic harmonic detection and no alert on the D point either. D is a zone, not a price — treat it as where a reversal thesis becomes testable, then wait for your own confirmation. For structures the platform finds on its own, see chart pattern detection and candlestick pattern detection — both drawn only on closed, confirmed candles.
Frequently Asked Questions
Does the XABCD tool show the retracement ratios between legs?
No. XABCD draws the zigzag, shades the two lobes and labels the pivots — it computes no ratios at all. The only ratio in this family is the AB=CD leg ratio on the ABCD tool. For XA, AB and BC measurements, draw the Fibonacci retracement tool over the leg you want to test, or let Auto Fibonacci keep a rolling grid on the chart underneath the pattern.
What exactly is the number next to the C point on an ABCD?
(C − D) / (A − B) from the prices of the anchors you placed, to three decimals — how far CD travelled relative to AB. 1.000 is a perfect AB=CD; 1.272 and 1.618 are the extended variants. It is omitted when A and B share a price, and takes no view on time symmetry or the BC retracement.
Why did my pivot letters disappear?
They render only while the drawing is selected — click the pattern to bring them back. That is also why they appear the moment you place the last point: finishing a drawing selects it. Turning off the Labels checkbox hides them permanently while keeping the geometry.
Do the patterns survive timeframe switches and page reloads?
Yes. Each anchor stores a timestamp as well as a price, so the pattern saves with your other drawings and re-projects onto the same moments in time on the new bars. The shape stretches or compresses; the pivots stay attached to the candles you chose.
Draw the structure, then test it
Open the Patterns flyout on any Crodl terminal chart, turn magnet on, and put a five-point XABCD over the swing you're watching. You get an exact, persistent skeleton with a clearly marked D. What the tool asks in return is that you do the measuring — which, with harmonics, was always the part that mattered.
This article is for educational purposes only and is not financial advice. Leveraged trading carries substantial risk of loss. Always do your own research and never risk more than you can afford to lose.

Ready to automate your trading?
Connect your exchange, set up automations, and start trading smarter — all from one platform.
Start Trading Free