Elliott Wave Drawing Tools: Five Label Sets for the Count You Actually See
Crodl's five Elliott Wave drawing tools — impulse, ABC correction, ABCDE triangle and the WXY / WXYXZ combos — label the wave count you place, click by click.
Elliott Wave is the most argued-about framework in technical analysis, and almost all of the argument is about counting. The theory states in a sentence: markets advance in five waves with the larger trend and correct in three against it. Applying that to a live chart is where it gets hard. Where did wave 1 begin? Is that a wave 4, or wave B of something bigger? Did the correction finish, or is this the X leg joining two structures?
Crodl does not try to settle any of that. The five Elliott tools in the chart's Patterns flyout are annotation tools: you click the pivots you believe in, each click plants the next labeled wave point, and the tool draws the line and pins the label. It has no opinion on whether your count is right — which, given how often counts get revised, is the honest way to build it.
What all five tools share
Underneath, these are one tool with five label sets. Every one behaves the same way:
- Click by click. Each variant needs a fixed number of anchors — four or six. Every click plants the next wave point and the drawing commits on the final one. Mid-placement, unplaced anchors collapse onto your most recent click, so the in-progress polyline stays clean and the newest leg tracks your cursor.
- A straight polyline through your points. No curves, no smoothing, no projection beyond the last anchor.
- A circled badge at every vertex. Each wave point gets a small filled circle with its label inside. Ring and text take the drawing's color; the fill is the chart's dark pill background, so labels stay readable over candles.
- Labels are always visible. Unlike most drawings, whose readouts appear only when selected, the wave badges render permanently — they are the entire point of the tool. They drop out only while you actively pan or zoom, when the chart switches to a reduced level-of-detail mode, and return the moment you stop.
- Every vertex is a handle. Drag one wave point to re-shape just that leg; drag the line's body — every segment is grabbable — and the whole count shifts together, keeping its shape.
- The same defaults. All five ship amber (
#ff8a1f), 1.4px, solid.
The five label sets
Elliott Impulse
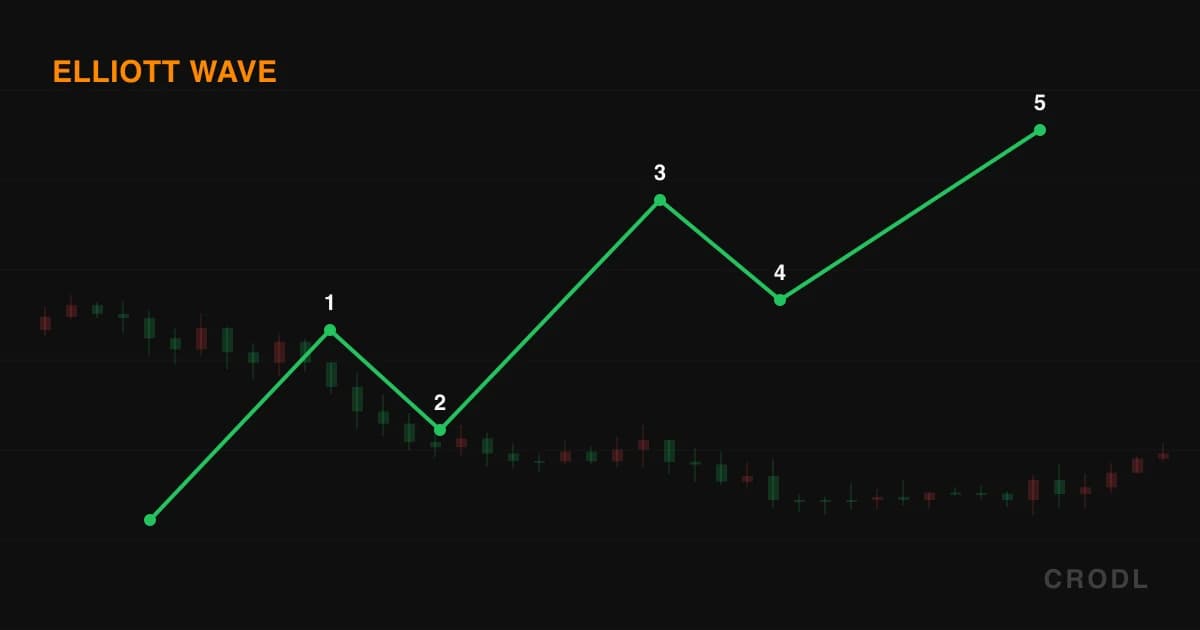
Six clicks, and the badges read 0, 1, 2, 3, 4, 5 — the origin plus five wave terminals. This is the motive structure, the one you reach for when price has completed, or is completing, a directional advance. A count reading 0-1-2-3 with a shallow 4 forming says the fifth leg is still owed; a completed 5 says the next structure should be corrective.
The impulse is the only one of the five whose origin badge is a plain 0. That is deliberate — an impulse starts its own degree.
Elliott Correction (ABC)
Four clicks: (0), A, B, C. The zigzag or flat that undoes part of an impulse — three legs, two of them against the correction's own direction.
The parenthesized (0) is the tell. On every corrective variant the origin is bracketed, because it does not belong to the correction: it is the end of whatever came before, borrowed as a starting point. A small typographic detail that stops a corrective count reading as a five-wave one at a glance.
This is the label set for pullbacks: an impulse finishes, price retraces, and you mark the shape of the retracement to judge whether the C leg has done enough work to justify a position in the original direction.
Elliott Triangle (ABCDE)
Six clicks: (0), A, B, C, D, E. Five legs, all corrective, each typically shorter than the last — the contracting-range structure that shows up in wave 4 positions and in the B wave of larger corrections.
Triangles are where a lot of counts go to die: a contracting range looks like consolidation, and consolidation looks like nothing at all. Labelling one forces you to commit to which swing is which, and E matters most — it is the last leg before the range resolves.
Elliott Double Combo (WXY)
Four clicks: (0), W, X, Y. When one corrective structure does not use up enough time or price, the market often runs two of them joined by a connector — W is the first correction, X the joining leg, Y the second.
Use this when a pullback you already labeled A-B-C keeps going and clearly is not an impulse. Rather than force a broken ABC, relabel it: the original correction becomes W, the bounce that fooled you X, the extension Y.
Elliott Triple Combo (WXYXZ)
Six clicks: (0), W, X, Y, X, Z. The same idea one step further — three corrective structures joined by two connectors.
Look closely: X appears twice. That is intentional, not a bug — both connector legs are X waves, and only the three corrective structures get distinct letters. This is the label set for the sideways grind that will not end, the chop that has already invalidated two cleaner counts.
Placing, fixing and keeping a count
Getting the pivots exact. Wave points want to sit on actual highs and lows. Turn on magnet mode with M and every anchor snaps to the nearest OHLC value of the candle under your cursor; if you keep magnet off, hold Ctrl (or Cmd) while placing to flip it on for that click alone.
Backing out. There are no keyboard shortcuts for these five tools; you pick them from the Patterns flyout. Escape returns you to the cursor and cancels any placement in progress, so a count started in the wrong place costs one keypress.
Revising. You will revise. Drag individual vertices to move single wave points without disturbing the rest; Ctrl/Cmd+Z steps back through changes. If the whole count needs to shift — same shape, wrong location — grab the body.
Styling. The context bar gives you color, line style, width, lock, visibility and delete. A Default button saves the current color, width and line style as the template for future drawings of that kind — handy for keeping impulses and corrections visually distinct.
Persistence. Wave anchors store both a timestamp and a price, so counts survive a reload and re-attach to the same moments in time when you switch timeframes. A count drawn on the 4h is still there, on the same candles, when you drop to the 1h.
Honest limitations
The tools do not validate anything. This is the big one. Elliott has hard rules — wave 2 cannot retrace beyond the start of wave 1, wave 3 cannot be the shortest of 1/3/5, and in an impulse wave 4 cannot overlap wave 1's territory. None of these are checked. Place a wave 4 deep inside wave 1's range and the tool draws it happily, labels and all. It renders what you clicked; verifying that what you clicked is a legal count is entirely on you.
There are no ratio readouts. No fib relationships between legs, no "wave 3 is 1.618× wave 1" annotation, no time projections. Measure ratios separately — the fib tools in the Lines flyout, or Auto Fibonacci — and read them alongside your count.
Nothing is detected for you. These are not scanners: no auto-count, no wave-degree selector, no alternate-count overlay. Compare Chart Patterns or Market Structure, which find their structures mechanically and draw only after confirmation. Elliott is not that kind of framework.
The Labels checkbox does not affect them. The settings popover's Labels toggle hides pills and readouts on other tools. The Elliott wave badges ignore it, by design — a wave polyline with no labels is just a zigzag.
And counts get revised. Not occasionally: routinely. Two competent analysts will label the same chart differently and both will be internally consistent. Treat a count as a hypothesis you drew, not a forecast the platform endorsed.
Frequently Asked Questions
Will the tool warn me if my wave 4 overlaps wave 1?
No. There is no validation of any kind — not the overlap rule, not the wave-2 retracement limit, not the shortest-wave-3 rule. The tool draws a polyline through your points and labels the vertices. Rule-checking is manual.
Why does the correction start at "(0)" instead of "A"?
Because the origin of a correction is not part of the correction — it is the terminal point of the structure being corrected, and the brackets mark it as borrowed. All four corrective variants use the bracketed origin; only the impulse, which starts its own degree, uses a plain 0.
Is the repeated X in WXYXZ a mistake?
No. In a triple combination both connecting legs are X waves — the sequence really is W, X, Y, X, Z. Only the three corrective structures get unique letters.
Can I run several counts at once?
Yes. Each placement is an independent drawing with its own anchors and styling, so a higher-degree impulse and a lower-degree correction can share a chart. Lock a finished count from the context bar so you do not drag it by accident while working on the next.
Label what you see
The Elliott tools are on every Crodl terminal chart, in the Patterns flyout of the drawing toolbar down the left edge. Pick the label set that matches the structure in front of you and click your pivots. The chart draws exactly the count you claimed — no more, and no less.
This article is for educational purposes only and is not financial advice. Leveraged trading carries substantial risk of loss. Always do your own research and never risk more than you can afford to lose.

Ready to automate your trading?
Connect your exchange, set up automations, and start trading smarter — all from one platform.
Start Trading Free