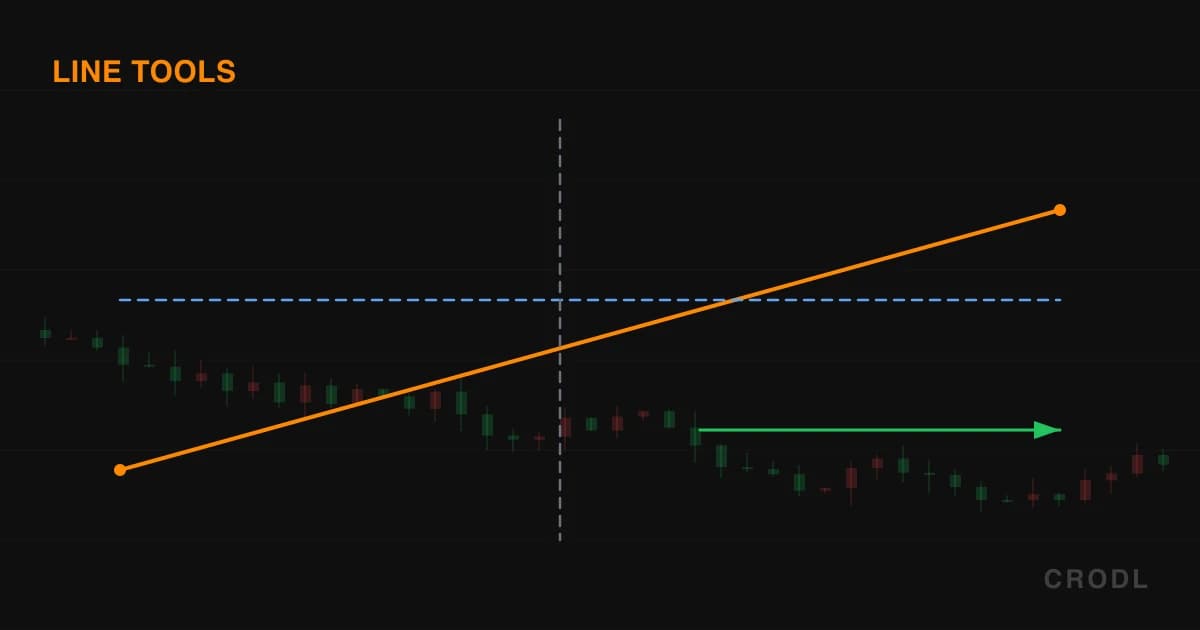
Trend Lines, Rays and Guides: Every Line Tool on the Crodl Chart
A guide to the ten tools in the Crodl chart's Lines flyout: trend lines, rays, arrows, horizontal and vertical guides, and two that measure as you draw.
Most of what a chartist draws is a straight line: a trend connecting two lows, a level under the last swing high, a marker on the candle where the news hit. The interesting question is never how to draw it — it is where the line should stop, and what it should tell you once it is there.
The Crodl chart answers that with ten tools rather than one line with a settings panel. They share the Lines flyout on the drawing toolbar down the chart's left edge; the small caret opens the group. Each tool places one drawing and hands the cursor back, and Escape cancels a half-placed line.
Two clicks, one segment
Trend Line (Alt+T)
Click the first anchor, click the second, and the segment stops at both. Unselected it is a clean line; select it and it becomes a measuring tool: an angle pill in degrees near the first anchor, a price pill at each anchor, and a delta pill at the midpoint showing the price difference and percentage move, with a triangle coloured green or red. Connect two swing lows for structure and "how big was that leg?" comes free. If you would rather the machine found the pivots, Automatic Trendlines does that.
Extended Line
Same two clicks, but the line through both anchors is projected to the left and right edges of the plot — infinite rather than a segment. Handles stay on your two anchors, and stacking them vertically draws a vertical line spanning the price pane instead. Selecting it shows a price pill at each anchor. Reach for it when the line is a permanent guide: does a diagonal from two old pivots still catch wicks today?
Ray (Alt+R)
The ray starts at your first anchor, passes through the second, and continues to the right edge with an arrowhead at the far end — always drawn, selected or not. This is the honest tool for a live trend line: it exists from the moment the trend started, and the part you care about is ahead of price rather than painted back across history.
Arrow (Alt+A)
Two clicks, and the line stops dead at the second anchor with a filled arrowhead there, sized to the stroke width. It defaults to yellow, and shows one price pill near the tip when selected. The arrow is for pointing, not measuring — flagging the candle that broke structure, or marking up a chart for your journal.
One click, one guide
Horizontal Line (Alt+H)
One click commits it. The line spans the full plot width at that price, with a price pill near the right edge in the line's own colour — and that pill shows all the time, not only when selected, so a chart full of levels reads without clicking anything. There are no handles: drag the body to reprice it. This is the workhorse — prior day high and low, round numbers, the level you drew before bed. Visible-range S/R finds levels automatically; this is the one you actually trade.
Horizontal Ray
One click again, but the line begins at the bar you clicked and runs right to the edge at that anchor's price. A single drag handle sits on the anchor, with a price pill there when selected. The distinction matters more than it sounds: a high swept on Tuesday did not exist last month, and painting it back there invents confluence that never was.
Vertical Line (Alt+V)
One click drops a vertical line through the price pane at that bar, dashed and pink by default. A pill at the top shows the anchor's time — always visible, and using the same formatter as the x-axis so the label and the tick beneath always agree. There are no handles, and dragging the body moves it in time only. Use it as an event marker: a CPI print, a listing, a funding flip. For recurring windows shaded automatically, ICT Killzones covers that ground.
Cross Line
One click draws both a full-width horizontal line and a full-height vertical line through the same point, thin and dashed by default. One handle sits at the intersection, and dragging it or the body moves the whole cross; selecting it adds a price pill on the horizontal arm. It is the fastest way to mark "this price, at this time" — the exact candle where a level was minted.
Two tools that measure
Both are two-click tools with the trend line's anchors, handles and drag behaviour. The difference: their measurement renders always, not only while selected — the number is the output, so it does not hide.
Trend Angle
Alongside the segment it draws a short dashed horizontal stub from the first anchor pointing toward the second, plus a pill showing the line's angle in degrees. The angle is computed in screen space, so it is the angle you can actually see, not an abstraction of price and time units. Rescale and the number moves with it — the point being that it says how steep this leg looks next to every other at the same zoom.
Info Line
Same segment, plus a compact card near the second anchor with three stats: the price delta, the percentage change to two decimals, and the bar count between the anchors. The first two are coloured green or red by direction, the bar count sits in muted grey, and the tool defaults to cyan so measurements stand apart from structural lines. "How far and how long" in one gesture — sizing a measured move, or checking whether a consolidation ran longer than its impulse.
Styling and housekeeping
Select any line and a floating toolbar appears: colour, line style (solid, dashed, dotted), width, duplicate, copy, paste, lock and delete. The gear adds per-drawing settings: Visible hides a drawing without deleting it, Labels keeps geometry while dropping every pill and card, and Set as default promotes this drawing's styling to the tool's template.
Magnet, toggled with M, snaps new anchors to the nearest open, high, low or close of the candle under your pointer — for wick-to-wick trend lines, the difference between a line that touches and one that nearly does. Ctrl or Cmd held while drawing inverts it.
Drawings persist, and anchors remember their candle's timestamp, so a timeframe flip re-pins each line to the same moment — as with the Anchored VWAP tool, also in this flyout.
Honest limitations
There is deliberate overlap. Trend Line, Trend Angle and Info Line draw an identical segment and differ only in what gets printed beside it. No tool has checkboxes for which stats to show, so you pick labels by picking the tool.
The angle is screen-space, so it is not portable. Two traders measuring the same swing at different zoom levels get different degrees. It is a relative measure inside your own layout, not a shareable number.
Placing a line deactivates the tool. Mapping five levels means pressing Alt+H five times. Intentional — a stray click cannot become a stray drawing — but slow for laying out a grid.
Dragging a whole line sideways re-pins it to bars, not to time. The anchors adopt the bar you dropped them on rather than their original timestamps, so nudging a line horizontally then switching timeframes can leave it a bar or two off.
Labels are not editable. The pills show prices, times and stats — there is no field for a note of your own. That is the Text tool's job, in the Annotate group.
Frequently Asked Questions
Which one should I use for an actual trend line?
Trend Line for a segment that ends where you clicked, Ray to carry it into the future, Extended Line to project it both ways — the same two clicks on the same two pivots. Most traders use Ray for live trends and Trend Line for annotating what already happened.
What is the real difference between a Horizontal Line and a Horizontal Ray?
Where the line begins. The horizontal line spans the entire chart at a price, with no anchor in time. The horizontal ray starts at the bar you clicked and only runs forward — the truer drawing when a level was created at a particular candle.
Can I stop the labels cluttering a busy chart?
Mostly. The pills on Trend Line, Extended Line, Ray, Arrow, Horizontal Ray and Cross Line only render while that drawing is selected, so an unselected chart is already clean. For the always-on ones — Horizontal Line, Vertical Line, Trend Angle and Info Line — untick Labels in the gear popover: geometry stays, text goes.
Straight lines, honestly drawn
The Lines flyout is on every Crodl terminal chart. Alt+T for a trend, Alt+H for a level, Alt+V to mark the moment it changed.
This article is for educational purposes only and is not financial advice. Leveraged trading carries substantial risk of loss. Always do your own research and never risk more than you can afford to lose.

Ready to automate your trading?
Connect your exchange, set up automations, and start trading smarter — all from one platform.
Start Trading Free