Pressure & Absorption Zones
Map estimated aggression, high-effort rejection, and the path of least resistance from closed OHLCV candles—without pretending candle data is an order book.
High volume does not tell you who won. A large green candle can represent clean buying, while a high-volume candle with a long upper wick can show buyers spending enormous effort and getting nowhere. The second event is often more useful: aggressive flow met enough opposing liquidity to absorb it.
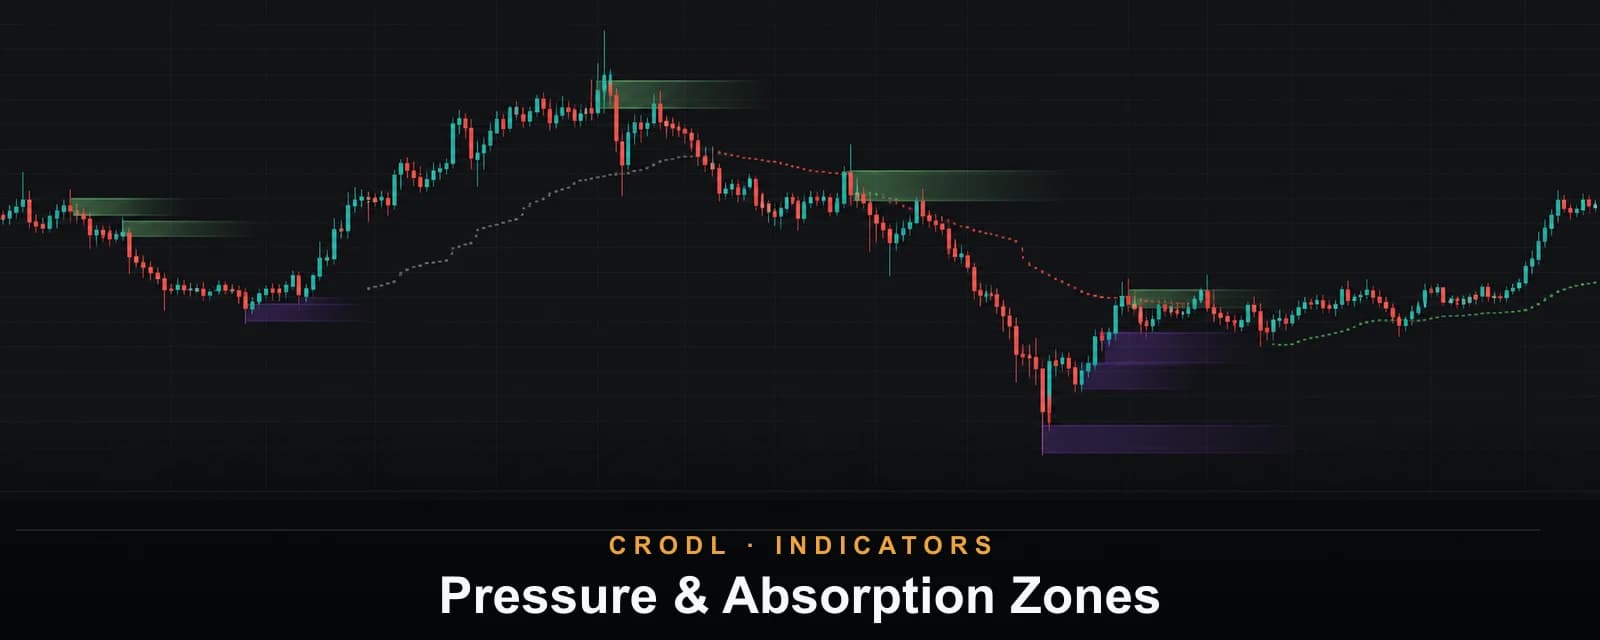
Pressure & Absorption Zones turns that effort-versus-result logic into a chart overlay. It combines candle-level aggression, relative volume, wick rejection, and a smoothed trend rail to mark the prices where pressure became unusually one-sided or was absorbed.
It is intentionally honest about the data. This is not a footprint or order-book study. When a feed supplies measured taker-buy volume, the aggression calculation uses it automatically. Otherwise, the study estimates the split from where the candle closed inside its range.
What appears on the chart
- Green zones for bullish pressure or downside absorption.
- Violet zones for bearish pressure or upside absorption.
- An optional path line, colored bullish, bearish, or neutral from the smoothed pressure score.
- Optional labels:
FLOWfor aggression,ABSfor absorption, andFLOW+ABSwhen both agree.
Every zone is created from a closed candle. Forming-candle noise cannot mint or move one.
The four pieces of the calculation
1. Aggression
If measured buy volume exists, buy share is buy volume / total volume. Without it, the close's position inside the high-low range becomes the proxy: a close near the high implies buying pressure, near the low implies selling pressure, and near the middle is balanced. The result is normalized from −1 to +1.
2. Effort
Current volume is divided by an exclusive rolling baseline—50 prior candles by default. Excluding the current bar matters because an extreme print cannot inflate the average used to judge itself.
3. Absorption
The study looks for elevated effort with a rejected edge. Heavy selling that leaves a meaningful lower wick and closes away from the low is bullish absorption; heavy buying rejected from the high is bearish absorption. The Sensitivity preset changes the minimum volume, aggression, wick, and score thresholds together.
4. Path of least resistance
Raw pressure is smoothed over eight bars by default, then blended 76/24 with price's ATR-normalized position around a 21-period EMA. The path line therefore reacts mainly to flow, with enough trend context to avoid treating every isolated volume burst as a regime.
How zones live and die
The zone uses the signal candle's rejected edge and body, with a minimum height of 0.28 ATR by default. It extends for eight bars unless a close breaks through its far side first. A bullish zone breaks when price closes below it; a bearish zone breaks on a close above it.
The three-bar cooldown prevents clusters of nearly identical events, and Retained zones limits historical clutter. Because the logic only advances on closed candles, historical zones are stable.
Settings that matter
- Sensitivity: Early produces more zones; Selective demands stronger effort and rejection; Balanced is the default.
- Volume baseline (50) defines what “unusual” volume means for the current market.
- Pressure smoothing (8) controls how quickly the path line changes color.
- Trend line length (21) controls the price-context rail.
- Zone cooldown / Zone length (3 / 8) control spacing and horizontal reach.
- Min zone height (0.28 ATR) prevents tiny reaction areas from disappearing visually.
- Signal labels are off by default to keep the overlay clean.
How traders use it
The strongest read is failed effort at an existing location. A bullish ABS zone forming after a sweep of equal lows, while the path line turns green, says sellers pushed volume through the market but failed to retain lower prices. The bearish mirror applies at resistance.
FLOW zones are better treated as continuation references. When price leaves a bullish pressure zone with an expanding body and later retests its upper edge, the zone marks where the initiative began. Confluence with S/R Zones or a volume profile makes the location more meaningful.
Frequently Asked Questions
Is this real order flow?
Only when the feed provides measured taker-buy volume, and even then absorption is inferred from price response. OHLCV cannot reveal the resting orders that caused the response. The indicator is an order-flow proxy, not a depth-of-market replacement.
Why did a high-volume candle produce no zone?
Volume alone is insufficient. The candle must also show enough directional aggression or rejection, clear the selected score threshold, and respect the cooldown.
Do the zones repaint?
No closed-candle zone is revised. The study excludes the forming candle from zone creation.
See effort and result together
Add Pressure & Absorption Zones from the Crodl indicator picker when you want volume context directly at the price where it mattered, without covering the chart in a separate footprint pane.
This article is for educational purposes only and is not financial advice. Leveraged trading carries substantial risk of loss. Always do your own research and never risk more than you can afford to lose.

Ready to automate your trading?
Connect your exchange, set up automations, and start trading smarter — all from one platform.
Start Trading Free