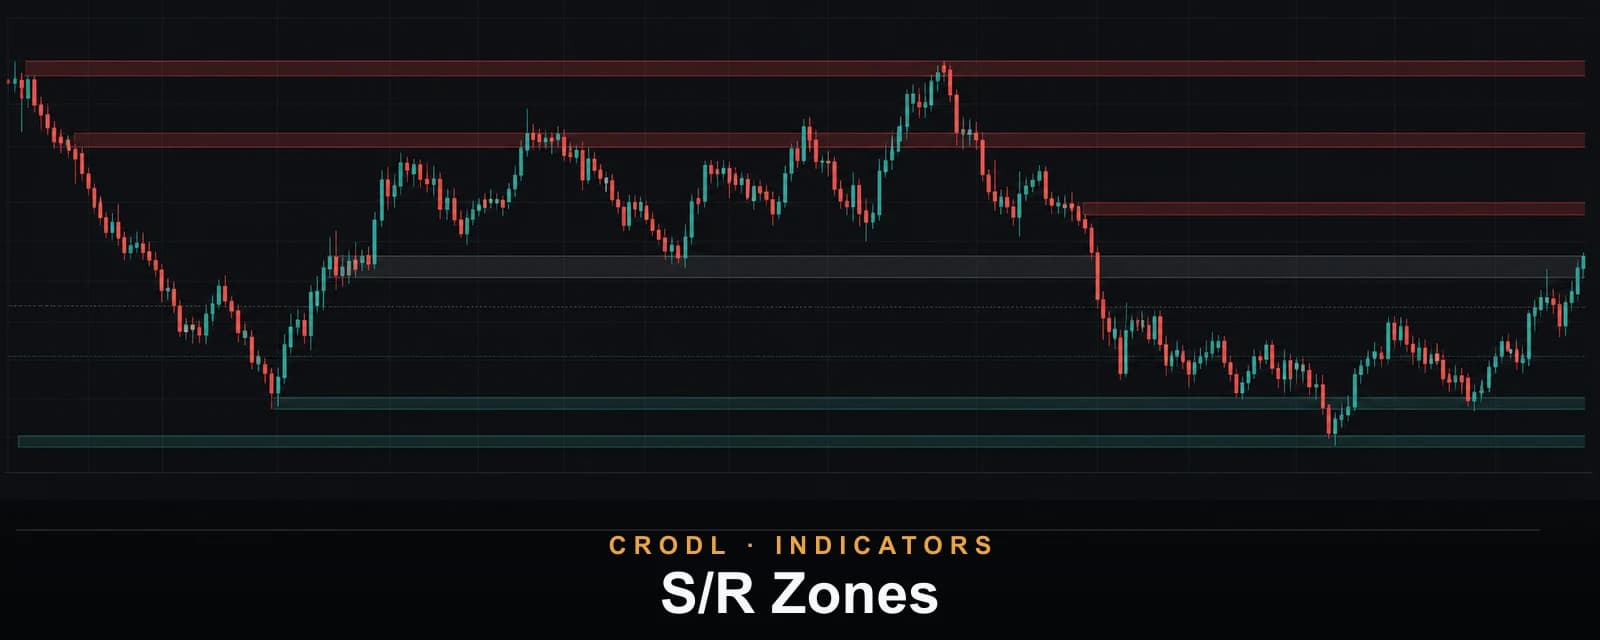
S/R Zones
Persistent support and resistance bands from confirmed pivots, with MTF calculation, volatility-aware merging, and explicit close-break behavior.
A price level is rarely one exact tick. Reactions spread across wick extremes, candle bodies, and slightly different tests of the same area. Drawing a single horizontal line hides that uncertainty; drawing every pivot creates a barcode.
S/R Zones on the Crodl terminal builds persistent support and resistance bands from confirmed swing pivots. Nearby levels can merge, broken zones have an explicit lifecycle, and the calculation can run on a higher timeframe while the zones remain projected onto the trading chart.
How this differs from Visible S/R
Visible S/R clusters the pivots currently on screen and rebuilds when you pan or zoom. It answers, “what matters in this viewport?”
S/R Zones is chronological. Each confirmed pivot creates or updates an independent zone, and that object keeps its history as future candles merge with it or close through it. Panning does not redefine the underlying zones. It is the better choice when you want stable structure and explicit break handling.
From pivot to zone
The defaults require ten bars on the left and ten on the right of a pivot. A candidate is not confirmed until those right-side bars are closed, so a zone never appears at an unknowable historical point.
Once confirmed, the pivot becomes resistance if it formed at a high or support if it formed at a low. Zone from controls its thickness:
- Wick to body uses the pivot candle's rejection anatomy and is the default.
- ATR band builds a symmetric volatility-sized area using ATR length and multiplier.
- Fixed % uses a percentage of the pivot price.
Minimum thickness places an ATR floor under every mode so a tiny-body pivot remains visible.
Merge, spacing, and retention
Markets often react several times within the same area. When a fresh pivot falls within Merge if within (0.75 ATR by default) of an existing same-side zone, the bands merge instead of stacking. The midpoint is recalculated from the merged bounds.
Min bars between zones suppresses rapid near-duplicates, while Max zones per side keeps a first-in, first-out limit of eight support and eight resistance zones by default. These controls preserve the chart's chronology without letting old structure overwhelm current price.
What happens after a break
Breaks use closed candles. A wick through resistance that closes back below it is a test, not a broken zone. When a close clears the far edge, choose one of three behaviors:
| Mode | Result |
|---|---|
| Recolour and keep | Zone turns gray and continues extending |
| Stop extending | Zone freezes at the break candle |
| Delete | Zone is removed |
The default Recolour and keep preserves polarity history. A broken resistance area can later be read as potential support without pretending it was never resistance.
Multi-timeframe structure
Select Chart or any supported timeframe from 3 minutes through 1 week. Higher-timeframe calculations use completed candles and reveal the result on the first chart bar after that higher-timeframe bucket closes. This lets a 15-minute execution chart carry stable 4-hour or daily zones without importing provisional HTF pivots.
The Extend right setting projects active zones beyond the last closed bar so they remain visible around the forming candle and a chosen number of future bars.
Settings that matter
- Pivot left / right (10 / 10) define swing selectivity and confirmation delay independently.
- Zone from plus ATR or percentage controls define band thickness.
- Max zones per side, merge distance, and minimum gap manage clutter.
- When price closes through determines historical lifecycle.
- Optional midlines and labels make the exact zone anatomy auditable.
- Separate support, resistance, and broken colors keep state legible.
How traders use the zones
The cleanest setup is a first retest after displacement. A strong impulse clears resistance, the zone turns gray, and price later returns from above. If the retest also overlaps a bullish FVG, two independently derived locations agree.
For risk, the far side of a zone is more meaningful than its midpoint. A long taken inside support is structurally wrong after a confirmed close below the lower edge; an intrabar wick through the edge may simply be the liquidity event that produces the trade.
Frequently Asked Questions
Do the pivots repaint?
No confirmed pivot moves, but confirmation is delayed by the configured right bars. Higher-timeframe zones wait for the selected candle to complete.
Why did two pivots become one zone?
Their distance was inside the ATR merge threshold. That is intentional: repeated reactions in the same volatility-sized area strengthen one zone rather than create duplicates.
Should I use lines or bands?
Use bands when the invalidation belongs beyond an area rather than at one tick. If your process depends on exact session levels such as VWAP or a prior high, a line is still the honest representation.
Keep structural levels stable
Add S/R Zones from the Crodl indicator picker for persistent, close-confirmed support and resistance that survives panning, supports higher-timeframe calculation, and records what happened after each break.
This article is for educational purposes only and is not financial advice. Leveraged trading carries substantial risk of loss. Always do your own research and never risk more than you can afford to lose.

Ready to automate your trading?
Connect your exchange, set up automations, and start trading smarter — all from one platform.
Start Trading Free