
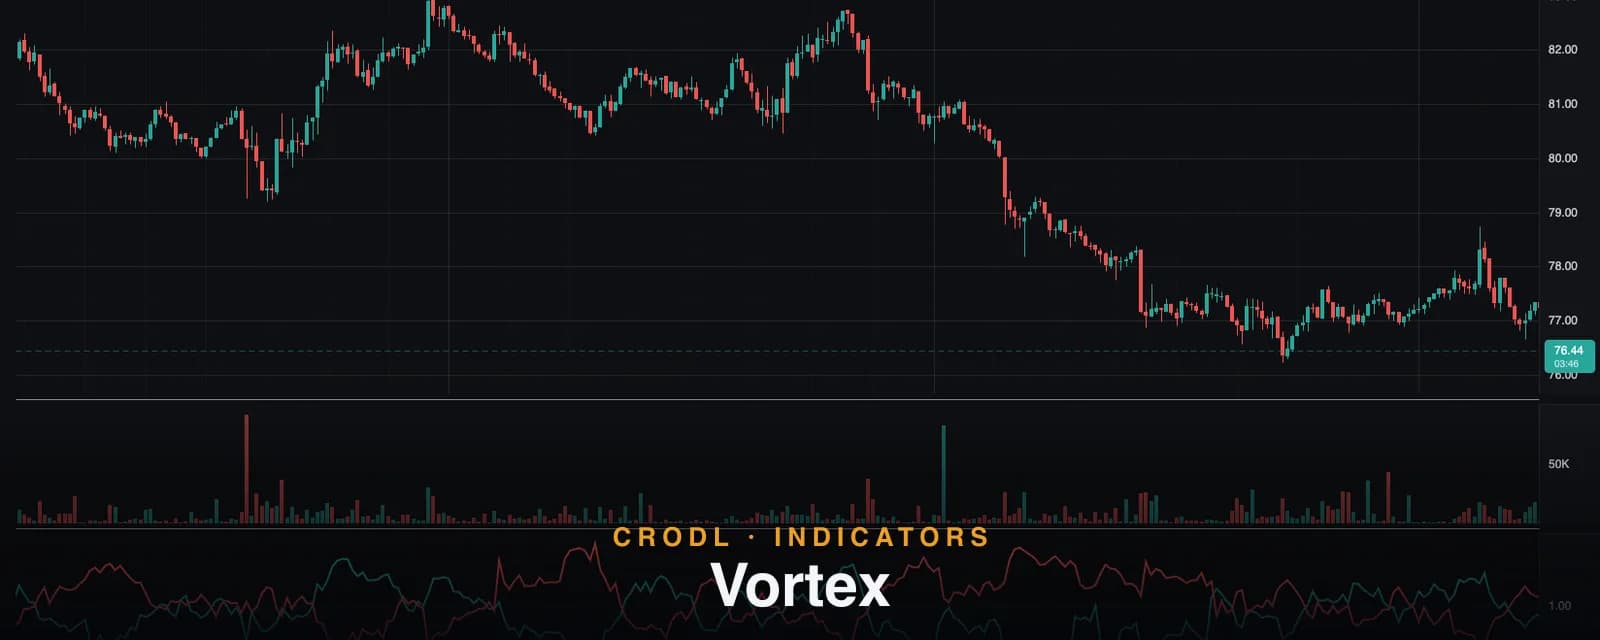
Vortex
The Vortex indicator tracks two lines, VI+ and VI−, built from bar-to-bar range extension. How Crodl's 14-period preset works and how to trade the crossovers.
Most trend indicators smooth price and then ask which way the smoothed line points. The Vortex indicator asks a more physical question: on each bar, how far did price stretch upward relative to yesterday's low, and how far did it stretch downward relative to yesterday's high? Trends, the reasoning goes, reveal themselves in which direction the market keeps reaching.
Etienne Botes and Douglas Siepman published the indicator in 2010, drawing on Viktor Schauberger's studies of vortex flow in water — the idea that motion in one direction contains the seed of rotation into the other. Mysticism aside, the mechanics are plain: two lines, VI+ and VI−, each measuring one direction of range extension over a rolling window. When VI+ is on top, upward stretch dominates; when VI− is on top, downward stretch does. The crossover is the signal.
The Crodl terminal ships the Vortex indicator as a Rune preset with the standard 14-period window. This post covers what the two lines measure, exactly how the preset computes them, and how traders use the crossovers — and their spread — on crypto pairs.
What the Vortex indicator measures
Each bar contributes two "vortex movements":
- VM+ = |current high − previous low| — how far this bar reached above the prior bar's floor
- VM− = |current low − previous high| — how far it reached below the prior bar's ceiling
A strong up-bar that gaps or thrusts well past the previous low produces a large VM+; a collapse through the previous high produces a large VM−. Note both are distances, not signed moves — the indicator measures the extension in each direction, and the crossing pattern of highs and lows does the directional work.
Both movements are summed over the lookback window and normalized by the total true range over the same window, so a period of wide, volatile candles does not automatically read as more trend than a quiet one. The output pair oscillates around 1.0: a VI+ of 1.15 means upward extension totalled 115% of the true range traded over the window.
How it works on the Crodl terminal
The preset has one functional input — Length, default 14 (adjustable 1–200) — and computes:
VI+ = Σ|high − low[1]| over 14 bars ÷ Σ true range over 14 bars
VI− = Σ|low − high[1]| over 14 bars ÷ Σ true range over 14 bars
True range is the standard Wilder definition (the greatest of high−low, |high−prev close|, |low−prev close|), so gaps are counted in the denominator just as they are in the numerators. If the window's true range is ever zero — a run of perfectly flat candles — both lines fall back to 0 rather than dividing by zero.
VI+ plots in teal and VI− in red, both weight-2 lines in their own sub-pane. There are no fixed reference levels drawn, because the levels that matter are relative: the two lines against each other, and both against the 1.0 equilibrium.
| Reading | What it means |
|---|---|
| VI+ above VI− | Upward range extension dominates — uptrend conditions |
| VI− above VI+ | Downward extension dominates — downtrend conditions |
| Both hugging 1.0, repeatedly crossing | No dominant direction — ranging, crossovers unreliable |
| Wide gap between the lines | Strong, one-sided trend in the direction of the upper line |
How traders use it in crypto
The crossover as a trend-change alert
The canonical signal: VI+ crossing above VI− flags a shift to upward dominance; VI− crossing above VI+ flags the reverse. On trending pairs and higher timeframes this works as designed — the cross tends to fire within a few bars of a genuine swing turn, earlier than heavily smoothed tools like TRIX will confirm it.
The failure mode is equally well known: in a range, the lines braid around 1.0 and cross constantly. The standard defence is a strength filter — only take Vortex crosses when ADX is above its trend threshold, or when the Vortex lines themselves separate decisively rather than kissing and re-crossing.
The spread as trend health
Beyond the cross itself, the distance between VI+ and VI− is a running readout of trend health. A healthy trend shows the dominant line holding well above 1.0 with the spread steady or widening. A trend that keeps making price highs while the spread narrows is being carried by momentum that is quietly failing — the same logic as oscillator divergence, read directly from range extension.
Entry timing inside a confirmed trend
Because the Vortex reacts bar-by-bar, some traders use it as the timing layer in a stack: direction and regime from a slower tool (a Supertrend flip or a TRIX zero-line regime), then enter on the next Vortex cross in that direction. This keeps the fast crossovers from being traded raw while still using their responsiveness.
Exits before the opposite signal
A long entered on a VI+ cross does not need to wait for the full VI− cross to exit — the dominant line rolling over and losing 1.0 is often the earlier, cheaper warning. In fast crypto reversals the difference between those two exits can be substantial.
Frequently Asked Questions
What is a "strong" VI+ or VI− reading?
Sustained readings above roughly 1.1 with the opposing line pinned below 0.9 mark decisive one-way extension on most pairs. But the indicator is normalized to each window's own true range, so treat levels as relative to the pair and timeframe you trade — study where past readings peaked on your chart rather than importing fixed thresholds.
How is Vortex different from ADX / DMI?
They are cousins — both derive from directional movement against true range. DMI splits each bar's move into +DM/−DM (only the larger side counts) and smooths with Wilder averages, adding the ADX strength line. Vortex uses raw high-to-prior-low and low-to-prior-high distances, both counted every bar, with simple rolling sums — so it is snappier, noisier, and has no built-in strength gauge. Many traders run both: Vortex for direction and timing, ADX for whether the move is worth trading.
Does a longer length help in crypto?
Lengthening to 21 or 34 cuts the range-chop whipsaws meaningfully at the cost of later signals — a common choice on the daily chart. Shortening below 14 is rarely worth it; the lines get fast enough that the crossover loses its meaning as a trend event.
Does the Vortex indicator repaint?
No. Each bar's VM+ and VM− depend only on the current and previous bar, and the sums cover closed history. The current bar's values move while the candle is live and are final at the close.
Put both directions on one pane
The Vortex indicator is available on every Crodl terminal chart — add it from the indicator picker and the 14-period VI+/VI− pair is on your chart in one click, alongside live trading on six exchanges.
This article is for educational purposes only and is not financial advice. Leveraged trading carries substantial risk of loss. Always do your own research and never risk more than you can afford to lose.

Ready to automate your trading?
Connect your exchange, set up automations, and start trading smarter — all from one platform.
Start Trading Free