
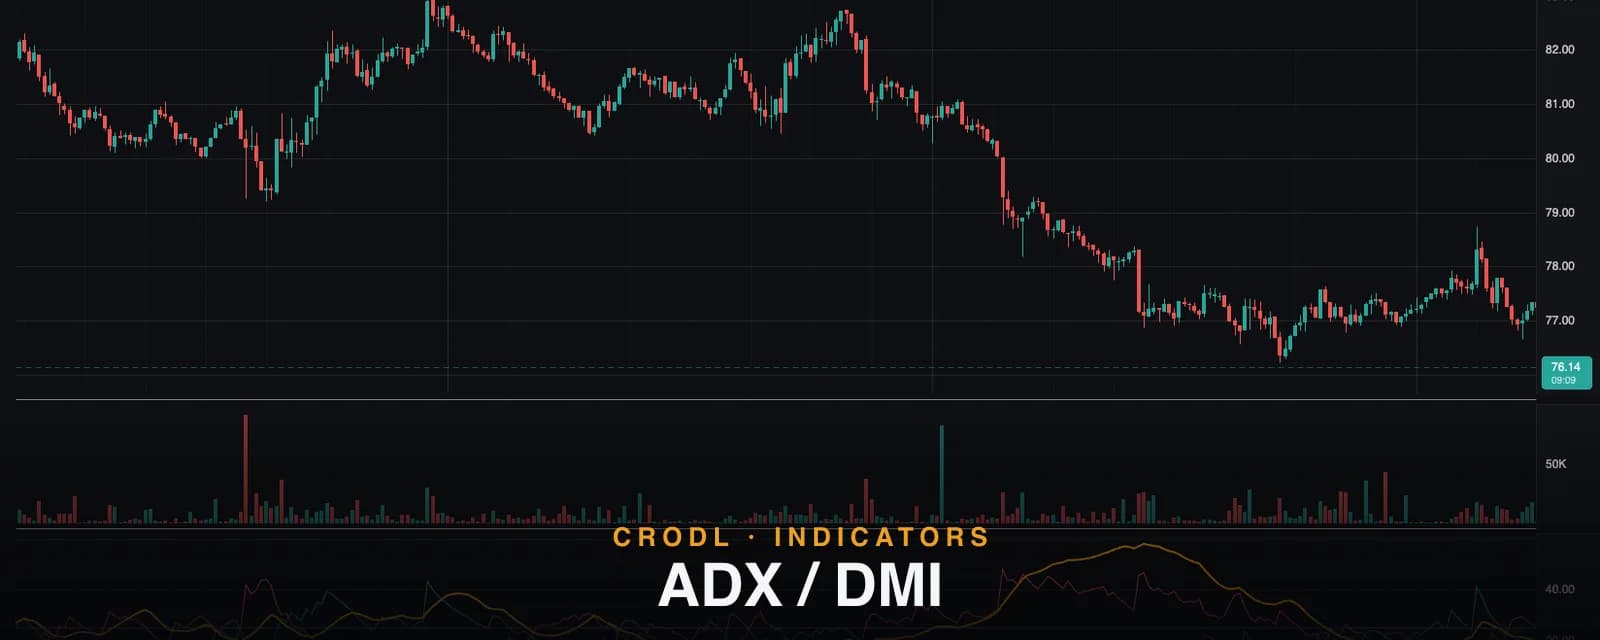
ADX / DMI
ADX measures how strong a trend is — never which way it points. How Crodl's ADX/DMI preset works, why the 25 line matters, and how +DI/−DI add direction.
The single most common way traders misread ADX: they see the line rising and assume price is going up. ADX does not know which way price is going. It was never designed to. A rising ADX during a waterfall crash is the indicator working perfectly — it is telling you the downtrend is strong.
That distinction — strength, not direction — is the entire point of J. Welles Wilder's Directional Movement system, published in 1978 and still the default answer to the question every other signal depends on: is this market trending at all? Breakout entries, moving-average crosses, and trend-following stops all perform in trends and bleed in ranges. ADX is the gauge that tells you which regime you are in. Direction is delegated to its two companion lines, +DI and −DI, which is why the tool ships as a trio.
The Crodl terminal includes ADX / DMI as a Rune preset with Wilder's classic 14/14 configuration and a dashed reference line at 25. This post covers what each of the three lines measures, exactly how the preset computes them, and how to combine them without falling into the direction trap.
What ADX and DMI measure
The system starts by splitting each bar's movement into directional components:
- Up move = current high − previous high
- Down move = previous low − current low
Only the larger of the two counts, and only if it is positive: if the up move wins, it becomes +DM and −DM is zero for that bar, and vice versa. An inside bar (neither a higher high nor a lower low) contributes nothing — by construction, only bars that extend the range in one direction carry directional information.
Both DM streams are smoothed and normalized by average true range to produce +DI and −DI — the percentage of recent range that was directional, up and down respectively. Whichever DI line is on top tells you the prevailing direction.
ADX is then built from the disagreement between the DI lines: the spread |+DI − −DI| as a fraction of their sum, smoothed again. When one side dominates completely the spread is wide and ADX rises; when buyers and sellers split the range evenly the spread collapses and ADX falls. That is why ADX is direction-blind — it measures how one-sided the market is, not which side is winning.
How it works on the Crodl terminal
The preset exposes two lengths, both defaulting to Wilder's originals:
- DI Length (default 14, range 1–200) — the Wilder-smoothing period for +DM, −DM, and the ATR they are normalized by:
+DI = 100 × RMA(+DM, 14) / ATR(14). - ADX Smoothing (default 14, range 1–200) — the second Wilder smoothing applied to DX, the per-bar spread ratio:
ADX = RMA(100 × |+DI − −DI| / (+DI + −DI), 14).
Both stages use Wilder's RMA (running moving average) — the slow, memory-heavy smoothing he designed the system around, which is why ADX turns deliberately rather than twitching. The pane draws +DI in teal, −DI in red, ADX as a heavier amber line, and a dashed horizontal reference at 25 — the conventional trending/ranging boundary.
One implementation detail worth knowing: the preset gates the ADX calculation until the DI lines have a full DI-Length window of history behind them, instead of letting the first few bars seed the average with garbage. Early-chart ADX readings are therefore usable almost immediately, and converge to the standard steady-state values.
| ADX reading | Regime | What most traders do |
|---|---|---|
| Below 20 | No trend / range | Fade extremes, avoid breakout entries |
| 20–25 | Indeterminate | Wait for the regime to declare itself |
| 25–50 | Trending | Trade with the dominant DI line |
| Above 50 | Very strong trend | Trail stops; late entries carry blow-off risk |
How traders use it in crypto
First as a filter, not a signal
The highest-value use of ADX is deciding which playbook applies. Above 25 and rising: trend tactics — breakouts, pullback continuation entries, trailing stops like Supertrend. Below 20: range tactics — fading band extremes, mean-reversion oscillators like the Ultimate Oscillator. Most oscillator "failures" are really regime failures, and this single filter removes the bulk of them.
DI crossovers, gated by ADX
+DI crossing above −DI is a buy signal in Wilder's original system — but ungated, it whipsaws in ranges just like any crossover. The standard gate: only take DI crosses when ADX is above ~20–25 or visibly turning up. A cross that happens while ADX is flat on the floor is two noise lines swapping places. Faster directional tools like the Vortex indicator suffer the same failure mode, and the same ADX gate fixes both.
Falling ADX after a strong trend
ADX rolling over from a high level does not mean reversal — it means the one-sidedness is fading. Strong crypto trends routinely pause, print a falling ADX while price consolidates, then resume with ADX turning back up. Treat a falling ADX as "trend tactics are losing their edge," not "short this uptrend."
Reading crashes correctly
In a leveraged crypto sell-off, −DI spikes over +DI and ADX climbs steeply. Traders who internalize "rising ADX = strength of the current move" read this instantly: the downtrend is strong, do not knife-catch until ADX flattens. Traders who read ADX as bullish momentum get hurt. Direction lives in the DI lines — or in a time-based tool like Aroon — never in ADX itself.
Frequently Asked Questions
Why is ADX so slow?
Two stacked Wilder smoothings (DI Length, then ADX Smoothing — 14 and 14 by default) make it roughly as slow as a 27-period average. That is deliberate: a regime gauge that flips daily is useless. If you need faster strength readings intraday, shorten ADX Smoothing before touching DI Length.
Is a DI crossover alone a trade signal?
Wilder himself added a filter — enter on a break of the signal bar's extreme, not the cross itself — and modern practice gates crosses with the ADX level. Raw DI crosses in a low-ADX range are the single most common way this indicator loses money.
What does it mean when ADX is high but the DI lines are converging?
The trend is strong as measured over the smoothing window, but the most recent bars are losing one-sidedness. It is often the earliest exhaustion tell the system gives — ADX itself will not roll over until several more balanced bars accumulate.
Does ADX work on altcoins?
Yes — arguably better than on majors, because altcoins spend more time in violent trend/dead-range alternation, which is exactly the regime split ADX detects. Normalization by ATR keeps readings comparable across price scales and volatility levels.
Know the regime before you pick the playbook
ADX / DMI is available on every Crodl terminal chart — add it from the indicator picker and all three lines, 25-line included, are on your chart in one click, alongside live trading on six exchanges.
This article is for educational purposes only and is not financial advice. Leveraged trading carries substantial risk of loss. Always do your own research and never risk more than you can afford to lose.

Ready to automate your trading?
Connect your exchange, set up automations, and start trading smarter — all from one platform.
Start Trading Free