
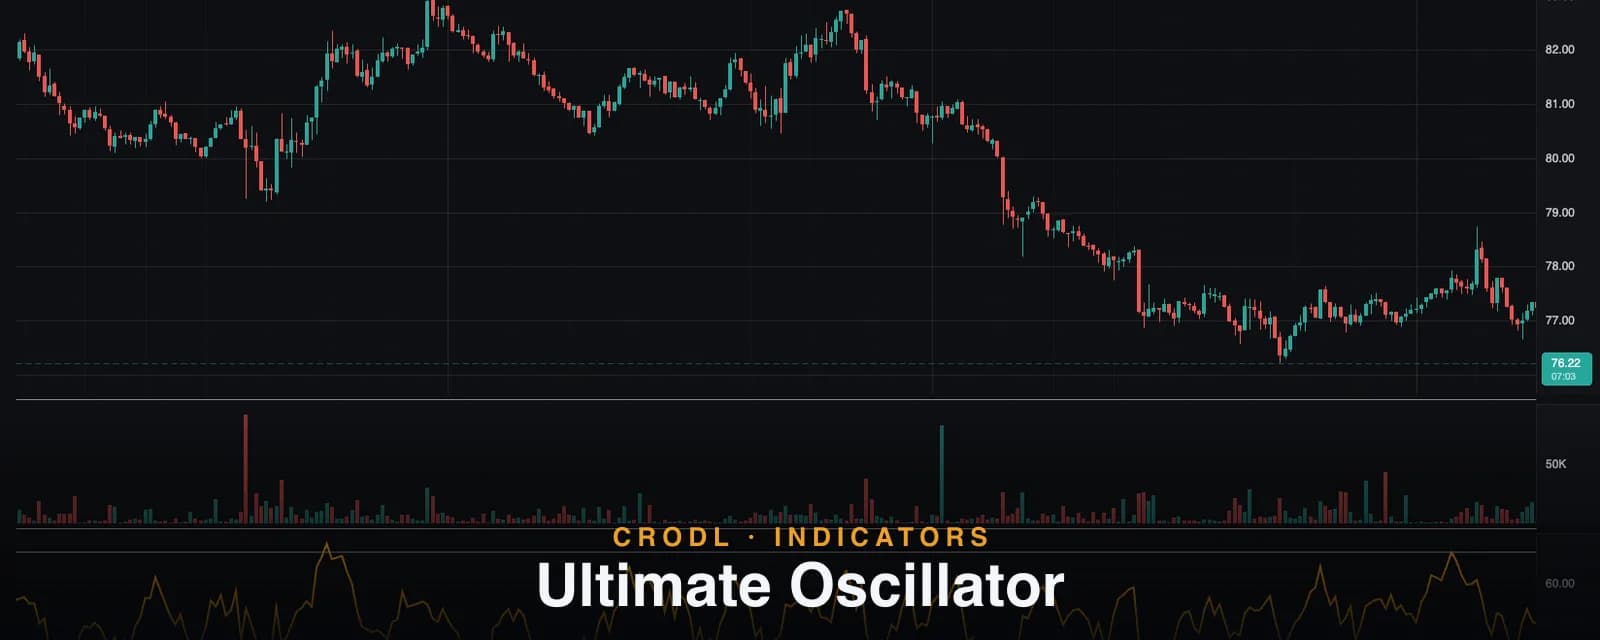
Ultimate Oscillator
Larry Williams built the Ultimate Oscillator to cut whipsaw by blending 7, 14, and 28-period buying pressure. How Crodl's weighted preset works in crypto.
Most momentum oscillators have one embarrassing habit: they commit to a single lookback period. Tune it short and you get a fast, twitchy line that fires false divergences on every wick. Tune it long and it turns up to the party after the move is over. Crypto — where a coin can chop sideways for a week and then travel 15% in an afternoon — punishes both settings.
Larry Williams designed the Ultimate Oscillator in 1976 to attack exactly that problem. Instead of picking one timeframe, it measures buying pressure across three windows at once — fast, mid, and slow — and blends them into a single weighted line. The fast window keeps it responsive; the slow window keeps it honest.
On the Crodl terminal the Ultimate Oscillator ships as a ready-made Rune preset with Williams' classic 7/14/28 windows and 70/30 reference lines. This post covers what the line actually measures, how the calculation works, and the divergence playbook Williams built the tool around.
What the Ultimate Oscillator measures
The core input is buying pressure: how much of each bar's true range the close captured. For every candle, the indicator computes:
- True low — the lower of the current low and the previous close
- True high — the higher of the current high and the previous close
- Buying pressure (BP) —
close − true low - True range (TR) —
true high − true low
A candle that closes at its true high has buying pressure equal to its full range: buyers won the bar completely. A candle that closes at its true low has zero buying pressure. Using the true range rather than the plain high/low means gaps count — a candle that gaps up and holds is credited for the gap.
Buying pressure over one candle is noise. Summed over a window and divided by the total true range, it becomes a percentage: of all the range the market traded, how much did buyers keep? That percentage, computed on three windows and blended, is the Ultimate Oscillator.
How it works on the Crodl terminal
The Crodl preset computes the BP/TR ratio over three configurable windows and combines them with fixed weights:
| Window | Default length | Weight in the blend |
|---|---|---|
| Fast | 7 | 4 |
| Mid | 14 | 2 |
| Slow | 28 | 1 |
Each window's average is 100 × sum(BP, N) / sum(TR, N), and the final line is:
UO = (4 × avg7 + 2 × avg14 + 1 × avg28) / 7
The fast window carries 4/7 of the weight, so the line responds quickly — but the mid and slow terms drag it back toward the longer-term balance of power, which is what suppresses the one-candle head-fakes a plain 7-period oscillator would print. If a window's total true range is ever zero (a run of completely flat candles), that window's term falls back to a neutral 50 rather than dividing by zero.
All three lengths are adjustable in the settings dialog — Fast from 1 to 100, Mid to 200, Slow to 400 — so you can widen the whole structure for high-timeframe swing work while keeping the 4/2/1 weighting. The line itself plots in amber in its own sub-pane, bounded between 0 and 100, with dashed reference lines at 70 (overbought) and 30 (oversold).
How traders use it in crypto
The Williams divergence setup
Williams did not build this tool for overbought/oversold scalps — he built it for a specific three-step divergence entry, and it remains the highest-quality signal the oscillator produces:
- Divergence forms. Price makes a lower low, but the Ultimate Oscillator makes a higher low — selling pressure is drying up even as price prints new lows.
- The oscillator low must be under 30. The divergence only counts if the first low happened in genuinely oversold territory.
- Breakout confirms. Enter when the oscillator breaks above the high it set between the two lows — not at the divergence itself.
The third step is what most traders skip and what makes the setup work: divergence alone is a condition, the breakout is the trigger. The bearish mirror (higher high in price, lower high above 70 on the oscillator, breakdown confirms) works the same way.
Overbought and oversold — with a trend filter
In ranging conditions, fading readings above 70 and below 30 works the way it does for any bounded oscillator. In a trend it is a donation strategy — strong crypto trends can pin the line above 70 for days. Pair it with a trend-strength gauge like ADX / DMI: fade the 70/30 extremes when ADX says no trend, and ignore them when ADX is climbing.
Confluence with slower momentum
Because the UO is deliberately blended and smooth, it pairs naturally with tools that answer a different question. A bullish UO divergence that appears while TRIX is curling up through its signal line, or while price is sitting on a lower Bollinger Band with %B near zero, is a far stronger case than any of those signals alone.
Frequently Asked Questions
How is this different from RSI or Stochastic?
RSI and Stochastic each use one lookback period and measure close-to-close change or close-in-range position. The Ultimate Oscillator measures buying pressure against true range across three periods simultaneously, weighted toward the fastest. In practice it divergences less often than RSI — and the divergences it does print carry more weight because the slow window has to agree.
Why 70/30 instead of RSI's classic levels?
They serve the same role — Williams simply calibrated his thresholds to the blended line's behaviour. Because the 28-period term anchors the blend, the UO reaches extremes less easily than a fast RSI, so a print above 70 or below 30 already implies broad agreement across all three windows. The levels are drawn as dashed lines on the Crodl pane by default.
Can I change the weights?
The 4/2/1 weighting is fixed in the preset — it is the defining feature of the indicator. The three window lengths are fully configurable, and stretching them (say 14/28/56) preserves the character of the blend at a higher timeframe.
Does it work on low-timeframe crypto charts?
Yes, with the caveat that applies to every oscillator: 1-minute divergences resolve in minutes, not days. The blend suppresses some noise, but signal quality scales with timeframe. Many traders run the default on the 4H for the divergence setup and consult it on the 15m only for entry timing.
Put three timeframes on one line
The Ultimate Oscillator is available on every Crodl terminal chart — add it from the indicator picker and the full 7/14/28 blend, reference lines included, is on your chart in one click, alongside live trading on six exchanges.
This article is for educational purposes only and is not financial advice. Leveraged trading carries substantial risk of loss. Always do your own research and never risk more than you can afford to lose.

Ready to automate your trading?
Connect your exchange, set up automations, and start trading smarter — all from one platform.
Start Trading Free