
TRIX
TRIX triple-smooths an EMA and plots its rate of change, filtering noise other momentum tools trip on. How Crodl's 15/9 preset works and how traders use it.
Every momentum oscillator makes the same trade: responsiveness for noise. Smooth the input once and you still inherit most of the market's chop; react to raw closes and you drown in it. Crypto makes the problem worse — perpetual futures print wicks that mean nothing and would send a naive rate-of-change indicator into a new signal every few candles.
TRIX — short for triple exponential — takes an unusually aggressive position on that trade. Developed by Jack Hutson in the early 1980s, it smooths the close three times with stacked EMAs before measuring anything, then plots the one-bar rate of change of that triple-smoothed line. The result is a slow, deliberate oscillator around zero that is close to immune to moves shorter than its length — by design, price action briefer than the smoothing window barely registers.
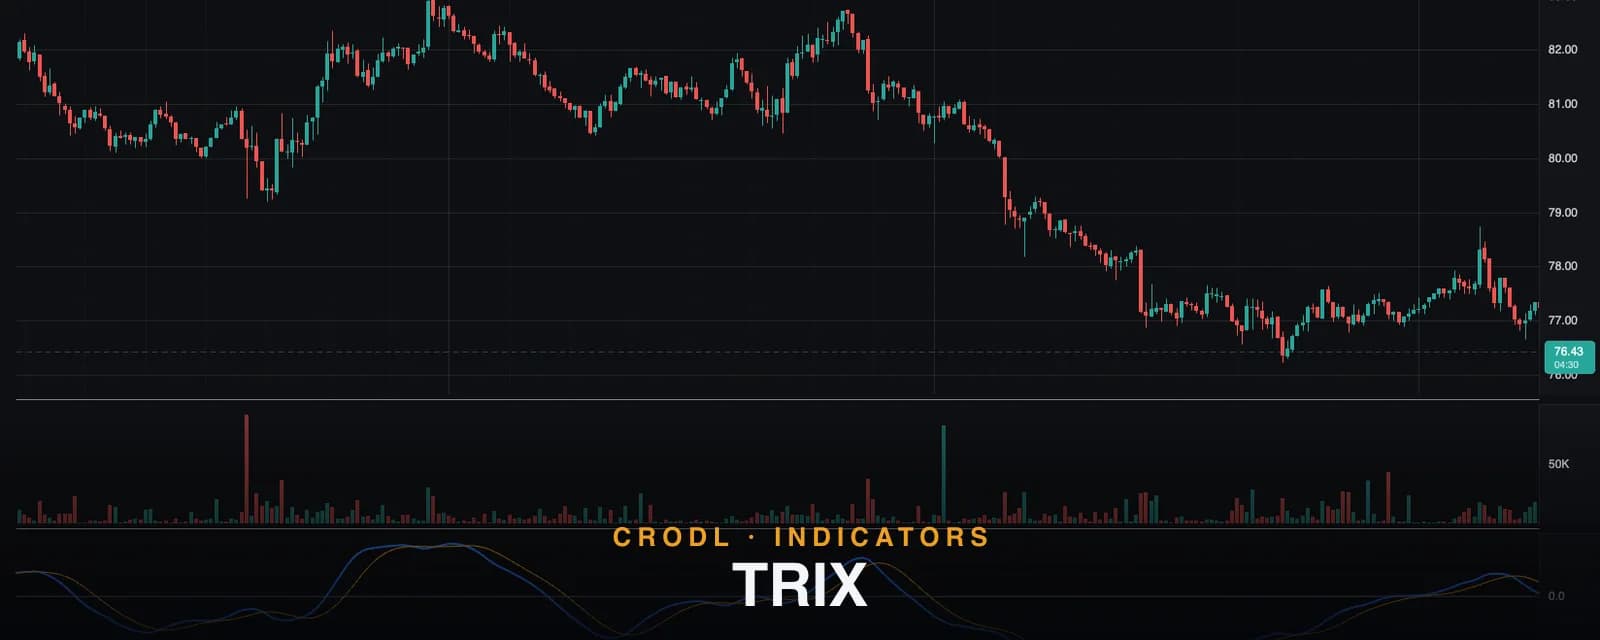
The Crodl terminal ships TRIX as a Rune preset with a 15-period triple EMA, a 9-period signal line, and a dashed zero line. This post covers what the line measures, exactly how the preset computes it, and where it earns its place on a crypto chart.
What TRIX measures
TRIX answers one question: is the smoothed trend accelerating or decelerating? The construction has two stages:
- Triple smoothing. Take the EMA of the close, then the EMA of that, then the EMA of that. Each pass suppresses another layer of noise; after three passes, only moves that persist across the full window survive.
- Rate of change. Measure how much the triple-smoothed line moved this bar versus last bar, as a proportion of its previous value.
Because the final step is a percentage change, TRIX is momentum of a trend proxy, not the trend itself. Positive TRIX means the triple-smoothed line is rising — the trend is gaining. Negative means it is losing. A TRIX that is positive but falling is an uptrend running out of thrust, often long before the price chart shows it.
The zero cross is therefore meaningful in a way most oscillator midlines are not: it marks the exact bar where the triple-smoothed trend flips from expansion to contraction.
How it works on the Crodl terminal
The preset exposes two lengths, both adjustable in the settings dialog:
- Length (default 15, range 1–200) — the period used for all three EMA passes:
e1 = EMA(close, 15),e2 = EMA(e1, 15),e3 = EMA(e2, 15). - Signal (default 9, range 1–100) — a simple moving average of the TRIX line itself, plotted alongside it.
The TRIX value is the one-bar rate of change of e3, scaled to basis points:
TRIX = 10000 × (e3 − e3[1]) / e3[1]
One point on the Crodl TRIX pane equals one basis point (0.01%) of change in the triple-smoothed close per bar — a scaling that keeps the line readable on low-volatility pairs where a raw percentage would be a flat smear. The main line plots in blue, the signal in amber, with a dashed zero line between them.
| Plot | Default | What it tells you |
|---|---|---|
| TRIX line | 15-period triple EMA ROC, in bps | Direction and thrust of the smoothed trend |
| Signal line | 9-period SMA of TRIX | The TRIX line's own trend; crossovers time entries |
| Zero line | Dashed at 0 | Regime boundary: expansion above, contraction below |
Note that the signal is a simple average in this implementation — slightly steadier than the EMA signal some platforms use, which suits the already-smooth line it tracks.
How traders use it in crypto
Zero-line crosses as regime filters
The cleanest use of TRIX is not as a trigger but as a filter. TRIX above zero: the triple-smoothed trend is up, so take long setups and skip shorts. Below zero: the reverse. Because three EMA passes make whipsaws expensive to produce, TRIX crosses zero far less often than MACD or a raw ROC — a 15-period TRIX on the 4H chart may flip a handful of times a month on a major pair, which is exactly what you want from a regime filter.
Signal-line crosses for timing
Inside a regime, TRIX crossing its 9-period signal line marks thrust returning to the trend. The high-quality version of the signal is the one in the direction of the zero-line regime: TRIX above zero, dipping toward the signal, then crossing back up. Counter-regime crosses (a bullish cross while TRIX is deep below zero) are early by construction — treat them as a heads-up, not an entry.
Divergence with the smoothed trend
Because TRIX filters so hard, a divergence against it is serious: if price grinds to a new high but TRIX prints a lower high, the persistent component of the move — not just a fast oscillator — is fading. Traders pair this with a faster tool for the trigger, for example an Ultimate Oscillator breakout, or check whether trend strength is confirming via ADX / DMI before acting.
What it costs you
TRIX's smoothing is honest lag. It will not catch reversals early, and in a violent V-bottom it can stay negative well into the recovery. That is the deal: you trade the first 10% of every move for immunity to most of the noise. Use it where that trade makes sense — trend confirmation and regime filtering — and use faster tools, like a Vortex crossover, for the turn itself.
Frequently Asked Questions
How is TRIX different from MACD?
MACD is the difference between two EMAs of price — one layer of smoothing, expressed in price units. TRIX is the rate of change of a triple-smoothed EMA, expressed in basis points. TRIX filters harder, whipsaws less, lags more, and its zero line marks trend expansion versus contraction rather than a fast/slow EMA relationship.
Why is my TRIX value so small?
It is a per-bar rate of change of an already-smooth line, so raw values are tiny — which is why the Crodl preset scales it by 10,000 into basis points. A reading of 25 means the triple-smoothed close is rising about 0.25% per bar. Compare readings against the same pair's own history rather than across assets.
What settings work for crypto?
The 15/9 default is a solid 1H–4H swing configuration. Intraday traders shorten Length to 9–12 to get more zero-crosses; position traders on the daily stretch it to 20–30 and treat the zero line as the only signal. Remember the length applies to all three EMA passes, so small changes compound.
Does TRIX repaint?
No. Every value is computed from closed-candle EMAs; the current bar's reading develops while the candle is live, like any oscillator, and is final at the close. Historical values never change.
Filter the chop, keep the trend
TRIX is available on every Crodl terminal chart — add it from the indicator picker and the full 15/9 preset with signal and zero lines is on your chart in one click, alongside live trading on six exchanges.
This article is for educational purposes only and is not financial advice. Leveraged trading carries substantial risk of loss. Always do your own research and never risk more than you can afford to lose.

Ready to automate your trading?
Connect your exchange, set up automations, and start trading smarter — all from one platform.
Start Trading Free