
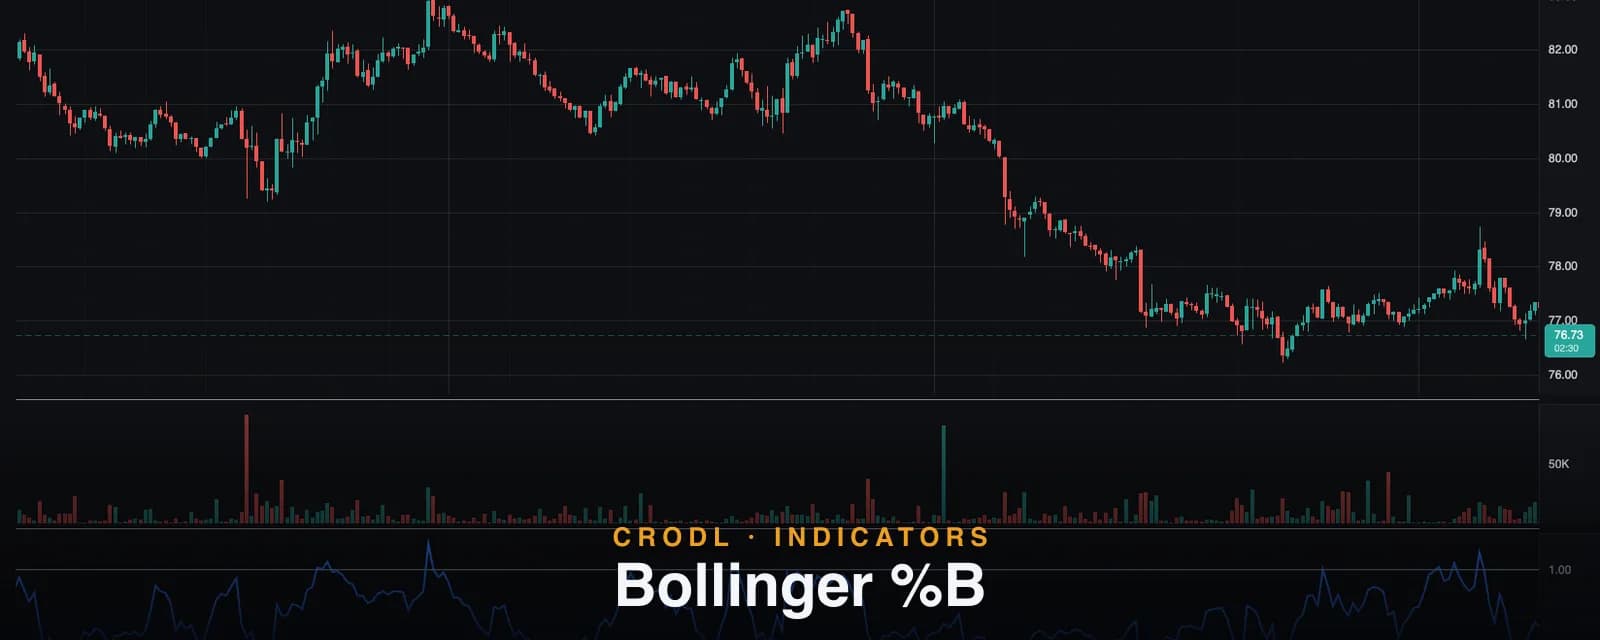
Bollinger %B
Bollinger %B turns band position into a single number, and Bandwidth gauges the squeeze. How Crodl's 20/2 preset works and how traders use both lines.
Bollinger Bands answer two questions at once — where is price relative to its recent average? and how volatile has it been? — but they answer both visually, as an envelope draped over the chart. That is fine for eyeballing. It is useless the moment you want to be precise: is price more stretched now than at last week's high? Is the envelope tighter than it was before the last breakout? The overlay cannot say.
%B and Bandwidth are John Bollinger's own answer: two derived lines that turn the bands into numbers. %B expresses where price sits within the bands as a value around 0–1. Bandwidth expresses how wide the bands are relative to their middle line. Together they extract everything the envelope knows and make it measurable — comparable across time, screenable, and usable as an input to rules rather than impressions.
The Crodl terminal ships both in a single Rune preset — Bollinger %B / Bandwidth — computed from the standard 20-period, 2-standard-deviation bands. This post covers what each line measures, exactly how the preset computes them, and the setups traders build on them. If you want the foundations of the bands themselves first, start with the Bollinger Bands guide.
What %B and Bandwidth measure
Both lines derive from the same three-band structure: a middle basis (a simple moving average of closes), an upper band (basis plus a multiple of standard deviation), and a lower band (basis minus the same).
%B maps the close onto that structure:
- 1.0 — close exactly on the upper band
- 0.5 — close on the basis
- 0.0 — close exactly on the lower band
Crucially, %B is unbounded: a close above the upper band reads above 1, and below the lower band reads below 0. Those overshoots are information — they mark statistically stretched closes, the raw material for both breakout confirmation and mean-reversion setups.
Bandwidth measures the envelope itself: the distance between the bands as a fraction of the basis. A reading of 0.08 means the bands span 8% of the basis price. Since band width is driven by standard deviation, Bandwidth is a direct volatility gauge — low readings mark compression (the "squeeze"), high readings mark expansion, and the cycle between them is one of the most reliable rhythms in markets.
How it works on the Crodl terminal
The preset exposes the two standard Bollinger inputs:
- Length (default 20, range 1–500) — the period for both the SMA basis and the standard deviation.
- StdDev Mult (default 2.0, range 0.1–10 in 0.1 steps) — the multiplier applied to standard deviation for the band offsets.
From those it computes, on every bar:
basis = SMA(close, 20)
dev   = 2.0 × stdev(close, 20)
%B        = (close − (basis − dev)) / 2·dev
Bandwidth = 2·dev / basis
If the bands ever collapse to zero width (a flat-price window), %B falls back to a neutral 0.5 rather than dividing by zero. The pane draws %B as a weight-2 blue line and Bandwidth as a thinner amber line, with dashed reference lines at 1 and 0 — the upper and lower bands, translated into %B space.
| %B reading | Where price is | Common interpretation |
|---|---|---|
| Above 1.0 | Closed above the upper band | Strong momentum or overextension — context decides |
| 0.8 – 1.0 | Upper region | Trending strength, or fade zone in a range |
| ~0.5 | At the basis | Equilibrium; pullback support in an uptrend |
| 0.0 – 0.2 | Lower region | Weakness, or accumulation zone in a range |
| Below 0.0 | Closed below the lower band | Statistically stretched down |
How traders use it in crypto
The squeeze: Bandwidth at multi-week lows
The classic Bollinger sequence — compression precedes expansion — becomes tradeable once Bandwidth quantifies it. When Bandwidth prints its lowest level in ~100+ bars, the pair is coiled; the resolution tends to be violent, especially in crypto where consolidations end with leverage-driven breaks. The squeeze itself is direction-neutral: traders wait for %B to break above 1 (long) or below 0 (short) as the expansion trigger. The dedicated Squeeze Momentum indicator formalizes the same pattern against Keltner Channels.
%B overshoots — trend fuel or fade signal, decided by regime
A %B above 1 means the close is more than two standard deviations above the 20-bar mean. In a fresh breakout from a squeeze, that is confirmation — Bollinger called riding repeated upper-band closes "walking the band," and closing longs just because %B tagged 1 is the classic way to exit a trend ten candles early. In an established range, the same reading is a fade setup. The regime call is the whole game, which is why %B pairs so well with a strength gauge like ADX: high ADX, respect the overshoot; low ADX, fade it.
%B divergence
Because %B normalizes price against its own volatility envelope, its divergences carry information raw price misses: a new price high with a lower %B high means the second push closed less stretched — the move is decelerating relative to its bands. Confirmed with a momentum oscillator such as the Ultimate Oscillator, this is one of the cleaner exhaustion patterns available.
Systematic rules
%B's biggest practical advantage is that it turns band logic into numbers automations can consume: "%B crosses below 0.8 after being above 1" is a precise, backtestable rule where "price rejects the upper band" is a judgement call. The same applies to screening — Bandwidth sorted ascending is a ready-made squeeze watchlist.
Frequently Asked Questions
Can %B really go above 1 or below 0?
Yes — that is the point. The bands contain most closes, not all of them; %B beyond the 0–1 range flags the statistically unusual closes that both breakout and mean-reversion strategies are built around.
What counts as a "low" Bandwidth?
There is no universal number — volatile pairs live at Bandwidth levels that would be extreme elsewhere. Compare the current reading to the same pair's own recent history: the standard squeeze definition is Bandwidth at its lowest point over the past 100–125 bars.
Why do %B and Bandwidth share one pane on Crodl?
They are two views of the same band structure and are read together: Bandwidth sets the context (compressed or expanded) and %B gives the trigger (which side breaks). %B lives around 0–1 and Bandwidth is typically a small fraction, so the amber Bandwidth line rides low in the pane — watch its shape, the coiling and flaring, rather than its level against the %B reference lines.
Do I still need the bands on my price chart?
Many traders keep both — the overlay for visual structure, the pane for precision. If you only want one, the pane carries strictly more usable information: everything the envelope shows, plus comparability across time.
Turn the bands into numbers
Bollinger %B / Bandwidth is available on every Crodl terminal chart — add it from the indicator picker and both lines, computed from the standard 20/2 bands, are on your chart in one click, alongside live trading on six exchanges.
This article is for educational purposes only and is not financial advice. Leveraged trading carries substantial risk of loss. Always do your own research and never risk more than you can afford to lose.

Ready to automate your trading?
Connect your exchange, set up automations, and start trading smarter — all from one platform.
Start Trading Free