
Aroon
Aroon measures time, not distance — how many bars since the highest high and lowest low. How Crodl's 14-period preset works and how to read the 0-100 lines.
Almost every indicator on your chart measures distance — how far price moved, how wide the range was, how big the average gain is. The Aroon indicator measures something none of them touch: time. Not how far price is from its recent high, but how many bars ago that high was set.
The insight, from Tushar Chande in 1995, is that trends are defined by recency as much as magnitude. An uptrend does not just make higher highs — it makes them constantly. The moment new highs stop arriving, the trend is aging, even if price has barely pulled back. "Aroon" is Sanskrit for dawn's early light: the indicator is built to catch the first light of a new trend and the fading of an old one, purely from the clock.
The Crodl terminal ships Aroon as a Rune preset with the standard 14-period window and a dashed midline at 50. This post covers what the two lines measure, exactly how the preset computes them, and the reading patterns that make Aroon useful on crypto pairs — including its underrated talent for spotting consolidations.
What Aroon measures
Aroon plots two lines, each scaled 0–100:
- Aroon Up — how recently the highest high of the lookback window printed. 100 means the current bar set it; 0 means it sits at the far edge of the window.
- Aroon Down — the same clock for the lowest low.
The formula converts bars-since-extreme into a percentage of the window. With the default length of 14, each new high resets Aroon Up to 100, and every bar without a new high walks it down by about 7 points (100/14). The lines say nothing about how big the moves were — a 0.5% grind to marginal new highs pins Aroon Up at 100 just as hard as a vertical rally. That indifference to magnitude is the feature: Aroon detects the persistence of a trend, which magnitude-based tools conflate with its violence.
Reading the pair is a two-line story. Fresh highs and stale lows (Up high, Down low) is an uptrend. Fresh lows and stale highs is a downtrend. Both lines decaying together in mid-range means neither extreme is being refreshed — price is consolidating.
How it works on the Crodl terminal
The preset has one functional input — Length, default 14 (adjustable 1–200) — and computes, on every bar:
Aroon Up   = 100 × (14 − bars since highest high) / 14
Aroon Down = 100 × (14 − bars since lowest low) / 14
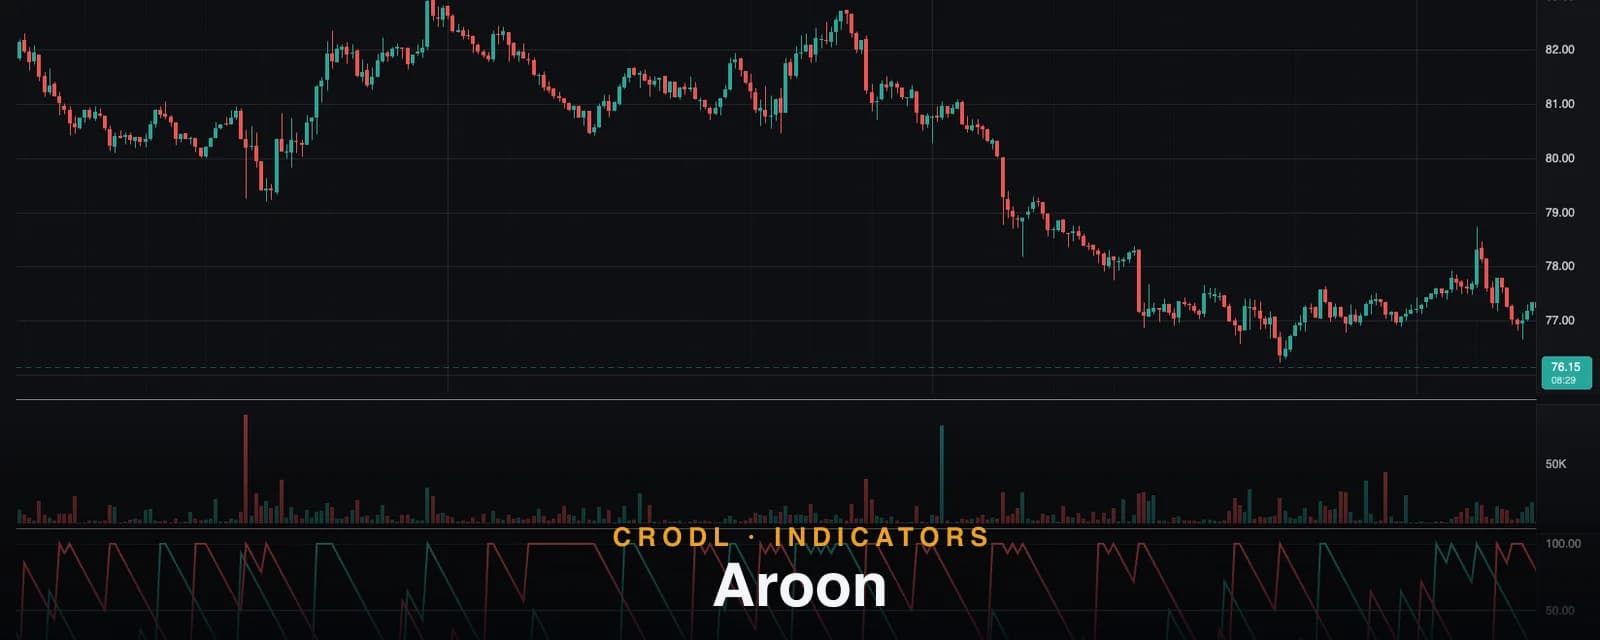
The scan covers the current bar plus the previous 14 (length + 1 bars in total), matching the standard definition, so a new extreme on the live bar reads exactly 100. Aroon Up plots in teal and Aroon Down in red, both weight-2 lines in a 0–100 sub-pane with a dashed reference at 50 — the halfway clock, marking whether an extreme happened in the front or back half of the window.
| Pattern | Reading |
|---|---|
| Up near 100, Down near 0 | Persistent uptrend — new highs keep arriving |
| Down near 100, Up near 0 | Persistent downtrend |
| Up crosses above Down | Bullish shift — most recent extreme is now a high |
| Both lines below 50, drifting down | Consolidation — no fresh extreme in half a window |
How traders use it in crypto
Crossovers as early trend-change flags
Aroon Up crossing above Aroon Down means the most recent extreme is now a high rather than a low — often one of the earliest mechanical signs of a turn, because it fires on recency rather than waiting for smoothed averages to bend. The cost of that speed is noise: in chop, the lines cross freely. The standard fix is the same one used for every directional crossover: gate it with a strength filter such as ADX, and only act when strength confirms a real trend is forming.
The 100/0 lock as trend confirmation
The highest-conviction Aroon pattern is not the cross — it is the lock: Aroon Up repeatedly tagging 100 while Aroon Down sits pinned near 0. That says new highs are arriving relentlessly and no meaningful low has printed in the entire window — the signature of the persistent crypto trends that trend-following systems are built to ride. As long as the lock holds, pullback entries stay on the table.
Both lines low: the squeeze nobody watches
When Aroon Up and Aroon Down both decay below 50, the market has printed neither a fresh high nor a fresh low in over half the window — a time-based definition of consolidation. Crypto consolidations resolve violently, so this state is a preparation signal: tighten your watchlist and let the next extreme declare the direction (whichever line snaps back to 100 first). Volatility-based squeeze tools like Bollinger Bandwidth or the Squeeze Momentum indicator flag the same compression from a different angle, and the two together are stronger than either alone.
Time-based exits
Aroon also works as an exit clock: if you are long a breakout and Aroon Up decays from 100 down through 50 without recovering, the market has gone half a window without a new high — the persistence that justified the trade is gone, even if price has not hit your stop. Momentum tools like TRIX tell you thrust is fading; Aroon tells you time has run out.
Frequently Asked Questions
How is Aroon different from ADX / DMI?
ADX measures how one-sided recent range extension is — magnitude-based strength. Aroon measures how recently the window's extremes printed — pure time. They fail differently: a slow grind of tiny new highs reads weak on ADX but pins Aroon Up at 100; a huge two-bar spike reads strong on ADX while Aroon barely registers persistence yet. Running both covers each one's blind spot.
What does a reading of 50 mean?
The extreme in question printed exactly half a window ago — 7 bars on the default 14. The dashed 50 line on the Crodl pane is the boundary between "recent" and "stale": lines holding above it mean the trend's extremes are still fresh.
What length should I use for crypto?
The default 14 suits 1H–4H swing trading. Day traders drop to 8–10 for faster resets; on daily charts, 25 — the length Chande often used — makes the lock pattern more meaningful because sustaining 100 requires weeks of persistent new highs.
Does Aroon repaint?
No. Bars-since-extreme is computed over closed history plus the live bar; the live bar's reading can change until the candle closes (as with any indicator), and historical values never move.
Put the clock on your chart
Aroon is available on every Crodl terminal chart — add it from the indicator picker and the 14-period Up/Down pair with its 50 midline is on your chart in one click, alongside live trading on six exchanges.
This article is for educational purposes only and is not financial advice. Leveraged trading carries substantial risk of loss. Always do your own research and never risk more than you can afford to lose.

Ready to automate your trading?
Connect your exchange, set up automations, and start trading smarter — all from one platform.
Start Trading Free