
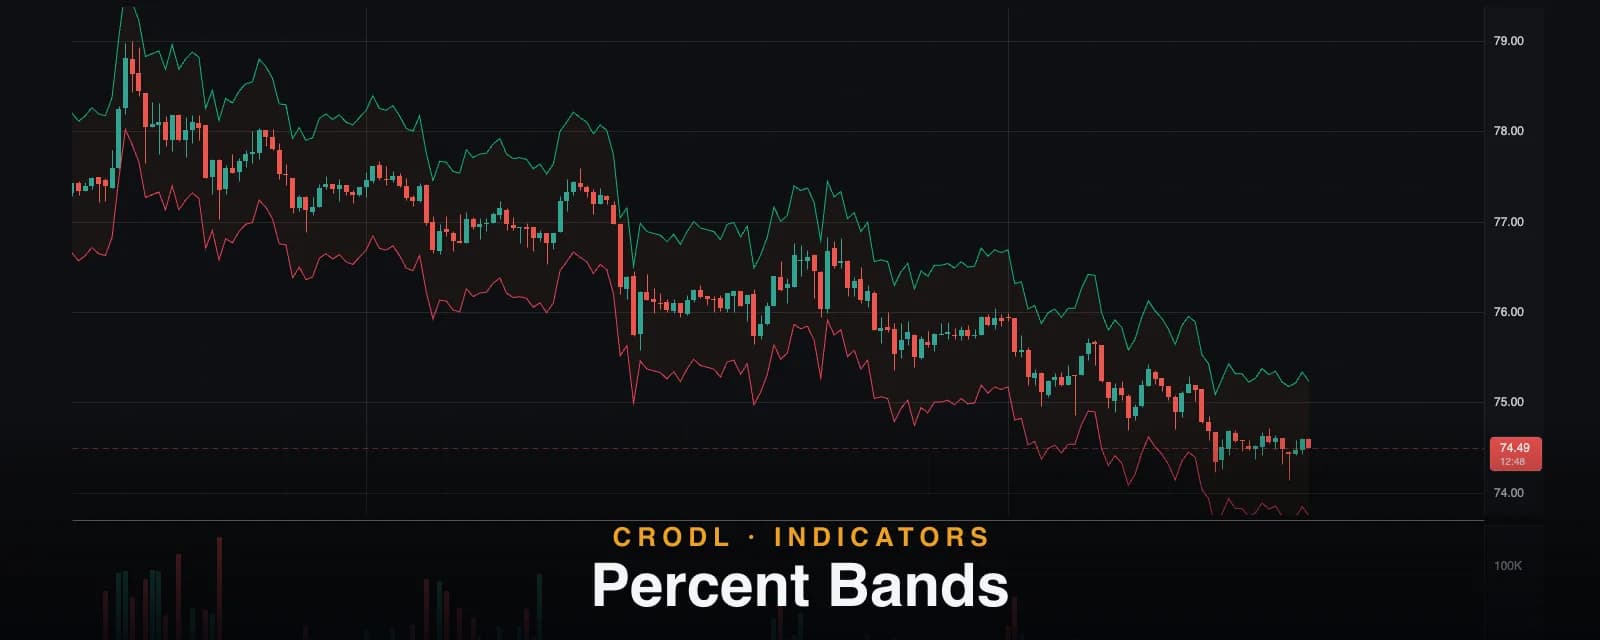
Percent Bands: A Fixed-Percentage Ruler for Every Chart
Percent Bands wraps price or an SMA basis in a fixed ±% envelope — a simple ruler for sizing moves, framing targets, and running classic envelope reversion.
Most bands on a chart adapt. Bollinger Bands breathe with standard deviation, ATR Bands with average true range — the width is always a moving target. That adaptivity is usually the point. But sometimes you need the opposite: a unit that never changes under you. What does one percent actually look like on this chart, at this zoom, right now? Where would a 2% stop sit? How many candles does this pair need to travel half a percent?
Percent Bands on the Crodl terminal is that fixed unit — a ruler drawn in price. It plots an upper and lower band at an exact percentage above and below a basis line, and by default the basis is simply the raw close, so the bands hug every candle at precisely ±1%. It ships as an open CRODL Rune preset, overlaid on price, with the source readable and forkable like every preset.
How the bands are built
The math fits in one line: the basis is a simple moving average of the close with length Basis Length, and the bands sit at basis × (1 + Band % / 100) and basis × (1 − Band % / 100). A translucent fill spans the pair.
The default Basis Length of 1 is the deliberate trick: an SMA of length one is the close, so the bands become the raw close shifted up and down by exactly Band %. Every candle carries its own ±1% markers. Raise the length to 20 or 50 and the same indicator becomes something else entirely — the classic percentage envelope: a smoothed centerline with fixed-percentage rails, one of the oldest mean-reversion tools in technical analysis.
One indicator, two personalities
| Mode | Basis Length | What the bands are | Typical use |
|---|---|---|---|
| Ruler | 1 (default) | Every close, shifted exactly ±Band % | Eyeballing move sizes, placing %-based stops and targets |
| Envelope | 20–50 | An SMA with fixed ±Band % rails | Classic envelope mean reversion, trend channels |
One design decision is worth calling out: the preset draws exactly one band pair. There is no multiplier ladder and no second ring. If you want stacked percentages — a ±1% ruler inside a ±2% ruler — add the indicator twice with different Band % values. Each instance stays a clean, single-purpose ruler, and you only stack when you mean to.
How traders use it
Size stops and targets in percent terms
Leverage math is percentage math: on a 20x position, a 0.5% adverse move is 10% of margin. A 0.5% ruler running on the chart converts that abstraction into geometry — you can see whether your stop distance is inside the last hour's noise or beyond it, before the ticket is ever filled. It also keeps take-profit placement honest: if price hasn't crossed the ±1% rail in forty candles, a 3% target on a scalp timeframe is a hope, not a plan.
Run the classic envelope
Set Basis Length to 20, turn on Show Basis, and tune Band % until roughly nine out of ten closes live inside the envelope. What remains is the old playbook: closes poking outside the rail are stretched relative to the recent mean, and fades back toward the basis are the trade. In trends the envelope tilts and the play inverts — price walking the upper rail is strength, and the basis becomes the pullback level. The same regime-dependence that governs Bollinger tags applies here, with one difference: this envelope's width never expands to excuse the move.
Calibrate your eye across symbols
Volatility differs wildly across pairs, and charts auto-scale to hide it. The same ±1% ruler dropped on BTC and on a mid-cap alt makes the difference visceral: one chart barely grazes the bands all session, the other slices through them hourly. That calibration — how much does this symbol actually move, in fixed units — is the daily-range question, and pairing the ruler with ADR Levels gives you both the per-candle and the per-day answer at once.
Settings that matter
- Band % (default 1.0, range 0.05–50) — the half-width of the envelope, in percent of the basis. The ruler's unit.
- Basis Length (default 1) — the setting's own hint says it: "SMA length for the basis — 1 hugs raw close." One for ruler mode, longer for envelope mode.
- Show Basis (default off) — off by default because at length 1 the basis just retraces the closes; turn it on in envelope mode, where the centerline is the mean-reversion target.
- Show Fill (default on) — the translucent wash between the bands.
- Upper Band / Lower Band / Basis — the three colors: teal, rose and amber by default.
An honest note on fixed width
A fixed percentage is volatility-blind by design. One percent is a meaningful move on a quiet major and background noise on a volatile micro-cap; the right Band % is different per symbol, per timeframe, and per regime, and nothing in the indicator will adjust it for you. That is the trade-off, stated plainly: adaptive bands answer "is this move unusual?" while Percent Bands answers "how big is this move, exactly?" The second question has a stable answer only because the unit never changes — which is also why the indicator will never tell you when the unit itself has become inappropriate. If you want the width to track conditions on its own, that job belongs to ATR Bands or Bollinger Bands; keep Percent Bands for measurement.
Frequently Asked Questions
How is this different from Bollinger Bands or ATR Bands?
Those bands derive their width from recent volatility, so the envelope expands and contracts as conditions change — good for judging whether a move is statistically unusual. Percent Bands' width is a constant you chose, so it is good for the opposite job: expressing moves, stops and targets in an exact, unchanging unit. Rulers do not stretch; that is what makes them rulers.
Why is there only one pair of bands?
By design. A single pair keeps each instance unambiguous — one number, one ruler. When you want concentric levels, add the indicator again with a different Band %: two instances at 1% and 2% behave exactly like a two-ring ladder, but each stays independently configurable and removable.
What does Basis Length 1 actually mean?
A simple moving average with length 1 is just the close itself — no smoothing at all. That makes the bands exact ±Band % offsets of every candle's close, which is the "ruler" mode the preset defaults to. Any length above 1 begins smoothing the basis and shifts the tool toward envelope behavior.
What Band % should I start with?
There is no universal number — that is the honest-note above in question form. A practical calibration: in ruler mode, pick the value that roughly matches your timeframe's typical candle-to-candle travel (often 0.3–1% on majors intraday); in envelope mode, widen until about 90% of recent closes sit inside the bands, then judge tags of the rails as genuine stretch.
Put a ruler on it
Percent Bands is one click away in the indicator picker on every Crodl terminal chart — drop a 1% ruler on your next session and see how many of your targets survive being measured.
This article is for educational purposes only and is not financial advice. Leveraged trading carries substantial risk of loss. Always do your own research and never risk more than you can afford to lose.

Ready to automate your trading?
Connect your exchange, set up automations, and start trading smarter — all from one platform.
Start Trading Free