
ADR Levels: The Average Daily Range as an Intraday Exhaustion Map
Average Daily Range exhaustion levels computed from your chart's own history — dynamic low+ADR and high−ADR caps, the ADR-used readout, and how day traders trade them.
Every market has a daily travel budget. Some days it spends more, some less, but averaged over a couple of weeks the distance between a day's high and low is remarkably stable — and that average is one of the oldest edges in day trading. If a pair typically ranges $900 in a day and it has already covered $850 by mid-session, the odds of it stretching much further are materially worse than they were at the open. Forex day traders have leaned on this number — the Average Daily Range (ADR) — for decades.
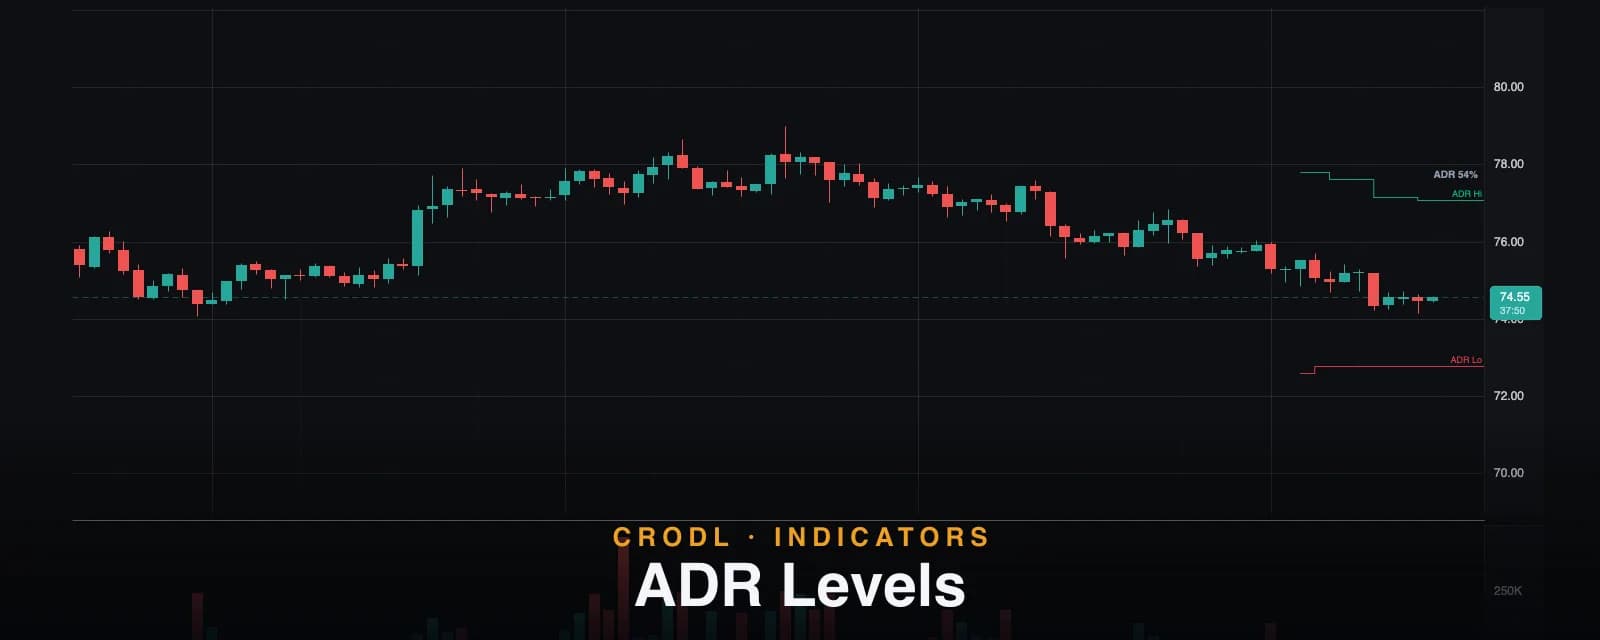
ADR Levels on the Crodl terminal turns that number into live chart levels, computed entirely from the candles already loaded — no external feed. It averages the last 14 completed days' ranges, then projects where today runs out of its budget: a pair of exhaustion levels that tighten inward as the session develops, an optional static projection around the open, and a running "ADR 84%" readout telling you how much of the budget is already spent.
What ADR measures
ADR is the simple average of the daily high − low over the last ADR length completed UTC days (default 14), always excluding the current developing day. Days are pure UTC calendar days — the same convention the Session Levels indicator uses, so both studies agree on where a day starts.
Two data-honesty rules protect the average:
- Truncated days are excluded. If your loaded history starts mid-day, that oldest partial day has an artificially small range and would silently drag the ADR down — so it is thrown out.
- Short history is disclosed, never hidden. With fewer than 14 completed days loaded, the indicator averages what exists and the readout appends the actual count — "ADR 62% (9d)" — so you always know a thinner sample fed the number.
The dynamic exhaustion pair
This is the heart of the indicator, and the part that surprises people the first time: the levels move — inward — during the day. The pair is defined as:
- ADR Hi = today's running low + ADR (teal)
- ADR Lo = today's running high − ADR (rose)
At the day's first bar, when high and low are nearly equal, the pair sits a full ADR apart in both directions. Every time the day prints a new high, ADR Lo rises; every new low pulls ADR Hi down. Price touching either level means the day has covered its average range — the budget is spent in that direction.
The levels draw as stepped lines from the day's first bar to the right edge, and the stepping is deliberate honesty: each horizontal segment reflects the running extremes as of that bar, so past segments never repaint — new intraday extremes add a step; nothing redraws history. And because running extremes can only ratchet outward, even the live step only ever moves inward.
The projection pair and the readout
Two supporting pieces complete the picture:
- Projection (open ± ADR/2) — a static, dashed pair (default off) at the day's open plus and minus half the ADR: where a perfectly average day centered on the open would top and bottom out. Useful as a pre-session sketch before any range has developed.
- ADR-used readout — a compact "ADR 84%" label near the right edge: today's range as a percentage of the average. It renders in neutral slate until the day crosses 100%, where it switches to the warning color — the day is now beyond its average budget.
| Level | Formula | Behavior | Default |
|---|---|---|---|
| ADR Hi | today's low + ADR | Steps inward as new lows print | On |
| ADR Lo | today's high − ADR | Steps inward as new highs print | On |
| +ADR/2 / −ADR/2 | day open ± ADR/2 | Flat all day, dashed | Off |
| ADR % readout | (high − low) / ADR | Recolors at ≥ 100% | On |
How traders use it
Fade exhaustion instead of chasing it
The classic ADR play: when price reaches ADR Hi late in the day, the average-range budget is spent — chasing longs there is statistically buying the most stretched moment of a typical day. Many day traders only fade toward the session's other levels once 80–100% of ADR is used, ideally at a level that matters structurally too.
Set targets inside the budget
If you enter a long mid-morning with 40% of ADR already used, the honest maximum for your target is roughly the remaining 60% — and ADR Hi marks it on the chart. Sizing targets beyond the day's typical travel is how winners round-trip into losers.
Spot trend days early
The readout blowing through 100% while price keeps making new extremes is the opposite signal: this is not an average day. Range-day tactics (fading edges, mean-reversion targets) should be shelved — trend days are precisely the days that pay breakout traders and punish faders.
Time it with the sessions
ADR spend is not linear through the day — most of it happens in the London and New York windows. Pairing ADR Levels with the ICT Killzones bands answers not just how much budget is left but when it is likely to be spent.
Settings that matter
- ADR length (days) (default 14, range 2–60) — how many completed days feed the average. Shorter adapts faster to regime changes; longer is steadier.
- Dynamic exhaustion pair (default on) — the stepped low+ADR / high−ADR levels.
- Projection (open ± ADR/2) (default off) — the static dashed pair around the open.
- ADR-used readout (default on) — the "ADR NN%" label.
- Upper level (low + ADR) / Lower level (high − ADR) / Projection / readout colors — teal, rose, and slate by default.
An honest note on averages
ADR is a budget, not a wall. Price exceeds its average range on plenty of days — that is what average means — and genuine trend days can print 200%+ of ADR. Touching ADR Hi shifts the odds; it stops nothing. Two more caveats: crypto has no closing bell, so "day" here is the UTC calendar day — a convention, not a law of nature — and the average is computed only from the candles you have loaded, so scroll back far enough for the full 14 days (the readout's "(Nd)" disclosure fires whenever you have not). Finally, the indicator hides itself on daily and higher timeframes, where an intraday exhaustion level has no meaning.
Frequently Asked Questions
Why do the levels move during the day?
By design. The exhaustion pair is anchored to today's running extremes: a new high pulls ADR Lo up, a new low pulls ADR Hi down. They only ever tighten inward, and past steps never repaint — the stepping you see in history is exactly what printed live.
Why does the indicator disappear on the daily chart?
ADR answers "how much of an average day is spent" — on a daily or weekly chart every bar is a full day or more, so the question is meaningless. The study gates itself off on daily-and-above timeframes rather than draw something misleading.
What does "ADR 84% (9d)" mean?
Today's high-minus-low equals 84% of the average daily range, and only 9 completed days (instead of the requested 14) were available in loaded history to compute that average. Load more history and the disclosure disappears.
Is ADR the same as ATR?
Related but different. ATR is the smoothed true range per bar on your current timeframe, gaps included. ADR is the plain average of full daily high-low ranges regardless of chart timeframe — a session budget rather than a per-bar volatility unit.
Trade the budget, not the hope
ADR Levels is live on every Crodl terminal chart — add it from the indicator picker and know, at a glance, how much of the day's typical range is already gone.
This article is for educational purposes only and is not financial advice. Leveraged trading carries substantial risk of loss. Always do your own research and never risk more than you can afford to lose.

Ready to automate your trading?
Connect your exchange, set up automations, and start trading smarter — all from one platform.
Start Trading Free