
Cascade Exhaustion: Fading Stop Runs with a Directional-Close Entry
How Crodl's Cascade Exhaustion study spots stop-cascade candles — a sweep of the prior extreme on outsized range and volume — freezes a stop, and only enters on the first directional close, with fixed risk/reward zones.
Every crypto trader has watched it happen: price grinds toward an obvious level, punches through it on one violent candle as the resting stops detonate, and then — nothing. The follow-through never comes, because the move wasn't new demand or supply; it was a cascade of forced exits. The fade of that candle is one of the oldest professional trades there is. The hard part is separating a genuine stop cascade from a real breakout, and then not front-running the reversal before the market confirms it.
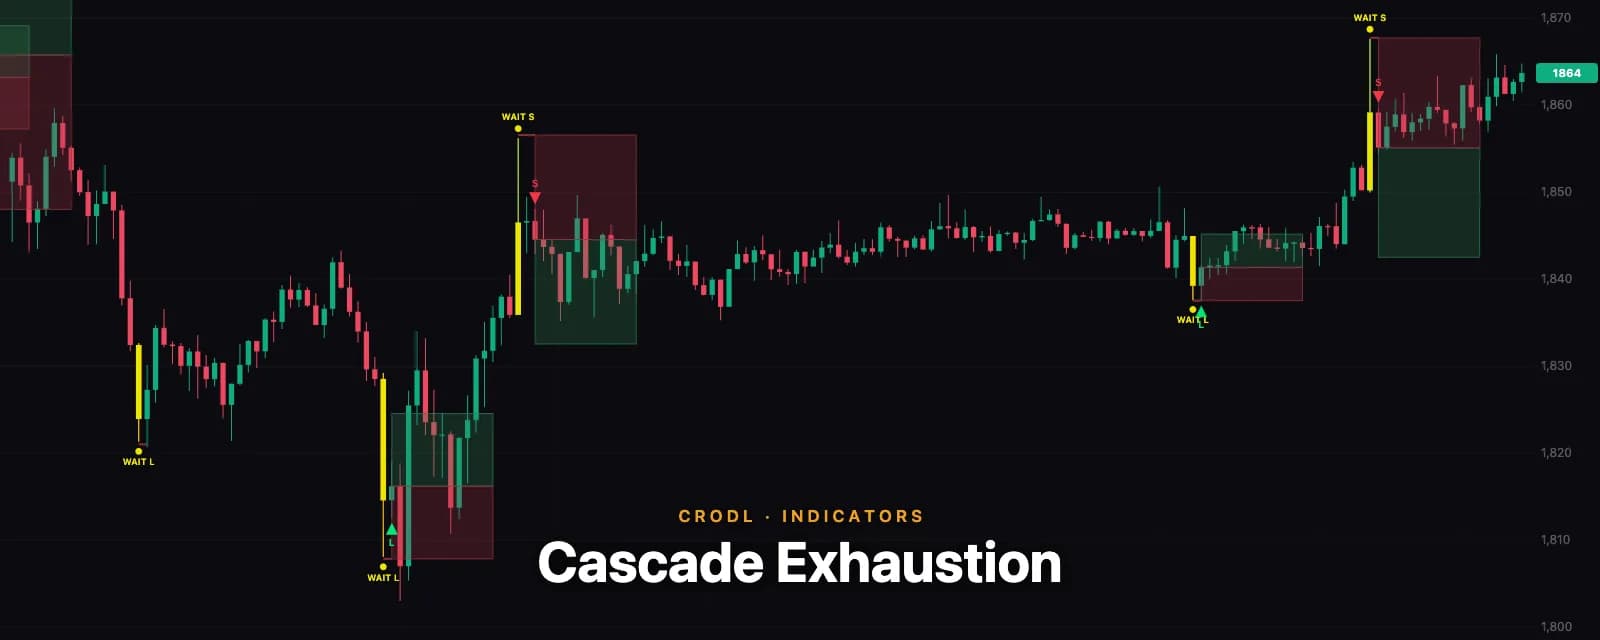
Cascade Exhaustion on the Crodl terminal mechanizes both halves. Stage one finds the cascade candle and marks it yellow. Stage two refuses to enter until a later candle closes in the fade direction — and the whole time, the stop stays frozen where the cascade said it should be.
Let's be precise about what this is: a transparent, chart-data proxy. It does not see the order book, hidden stops, or liquidation feeds. It infers a probable stop cascade from what a candle did — sweep, range, volume, rejection — with every threshold exposed as a setting.
Stage one: the yellow setup candle
A closed candle qualifies as a cascade proxy when all of the following hold:
- It sweeps a prior extreme — trading beyond the highest high or lowest low of the last
Prior-extreme lookbackcompleted bars (default 20) by at leastMin sweep× ATR. That's where the stops lived. - Its range is outsized — at least
Min candle range× ATR (default 1.25). Cascades are violent; ordinary probes are not. - Its volume is elevated — at least
Min volume ratio× the prior 50-bar average (default 1.75×). Stops firing are real orders printing. - Its body matches the cascade — an upside sweep on an up candle, a downside sweep on a down candle (toggleable), and candles sweeping both sides are discarded by default as ambiguous.
- It shows same-bar rejection — by default a rejection wick of at least 15% of the range back from the swept extreme; alternatively a full reclaim close back through the swept level, or no same-bar filter at all (Cascade only).
A candle that passes everything is painted yellow, tagged WAIT L (downside cascade — a long fade is hypothesized) or WAIT S (upside cascade), and — crucially — a stop is frozen just beyond its extreme (Stop buffer × ATR past the sweep wick). One setup is pending at a time, and accepted setups start the cooldown.
Stage two: the directional-close entry
The yellow candle is a hypothesis, not a trade. The entry requires the market to agree:
- The first bar within the wait window (default 5 bars) that closes in the fade direction — a bullish close for a pending long, a bearish close for a pending short — confirms the entry at that close. A doji confirms nothing.
- If any waiting bar touches the frozen stop first, the setup is cancelled — the cascade kept going, and the hypothesis was wrong. This check runs before the bar's own close is considered.
- If the window expires without a directional close, the setup quietly expires.
The risk/reward zones draw from the confirmation close, not the yellow candle: green reward zone to the target (Reward : risk × the risk distance, default 1:4), red risk zone down (or up) to the stop — which never moves from where the yellow candle froze it. While a setup waits, the frozen stop draws as a line so you can see exactly what invalidation looks like before committing.
That frozen stop is the design's quiet edge: the confirmation candle often closes some distance from the sweep extreme, so your entry improves while your invalidation point stays anchored to the structure that actually matters — the cascade's wick.
How traders use it
The fade, patiently
The whole indicator is one trade: fade the cascade, but only after a close agrees. The two-stage design absorbs the most common failure mode of sweep-fading — entering into a cascade that has one more leg — by making the stop-touch cancel the setup before any entry exists.
Confluence with resting-liquidity maps
A cascade needs fuel. Yellow candles that fire into levels Liquidity Zones already flagged as swept-liquidity magnets, or that coincide with a Volume Bubble print, carry the strongest case that stops — not initiative flow — drove the move. The W & M patterns tell the same story at swing scale: their sweep leg is often exactly one of these candles.
Structure downstream
A cancelled setup is information too: the "cascade" that ran through its own invalidation level was probably a genuine breakout — at which point Breakout Retest logic takes over on the level that broke.
Settings that matter
- Prior-extreme lookback / Min sweep / ATR length — where stops are presumed and how decisively they must be run.
- Min candle range / volume thresholds — how violent the candle must be. Raising these is the main lever for signal quality.
- Rejection filter — Wick rejection (default), Reclaim prior level (strictest), or Cascade only (none).
- Max bars to wait (default 5) — how long a yellow setup stays armed for its directional close.
- Cooldown / Setup direction — signal spacing and long-only/short-only operation.
- Risk group — frozen stop buffer, reward:risk (default 1:4), retained setups. The zones themselves need no width setting: they extend rightward until the trade resolves — the first later bar to touch the frozen stop or the target ends the boxes there, and an open trade's boxes ride along with the chart.
- Visuals — yellow candle paint, WAIT and entry markers, the frozen-stop line, optional rolling sweep levels, the zone colors/opacity, and an optional hit-rate table (off by default) summarizing the computed history as wins / losses / win-rate — e.g.
12W / 8L · 60% WR— so you can judge a pair and timeframe at a glance before trusting the setups on it.
Honest limitations
This is inference from OHLCV, not observation of stops — a candle can sweep a level on outsized volume for reasons that have nothing to do with cascading liquidations, and the indicator cannot tell the difference. Signals confirm at bar close and never repaint, which also means the entry always comes after the reversal has begun; you trade later but with evidence. The example risk/reward zones are geometry, not advice — a 1:4 zone drawn on the chart says nothing about hit rate, and a high reward multiple mechanically means more stop-outs than targets. And on thin pairs, the volume baseline itself is noisy; the volume gate is only as meaningful as the tape behind it.
Frequently Asked Questions
Does it repaint?
No. The yellow candle is decided entirely on its own closed bar, the entry on a later closed bar, and both use prior-bar reference values (levels, ATR, volume baseline). Once drawn, setups and entries never move. A cancelled or expired setup keeps its yellow candle — the history stays honest.
Why did a yellow candle never produce an entry?
Three possible fates: a waiting bar touched the frozen stop (cancelled — the cascade continued), the wait window passed without a directional close (expired), or it's still waiting. The frozen-stop line makes the first case visible on the chart.
Why not enter on the yellow candle itself?
Because the most expensive sweeps are the ones with a second leg. Requiring a later directional close costs a few ticks of entry on the clean reversals and avoids the worst entries entirely — that's the trade-off the two-stage design chooses, deliberately.
Is the stop really never adjusted?
Never. It's computed from the yellow candle's extreme plus an ATR buffer, and both the cancellation check and the drawn risk zone use exactly that price. If the confirmation close lands far from the sweep, your reward:risk simply improves.
Fade the panic, not the trend
Cascade Exhaustion is live in the indicator picker on every Crodl terminal chart. Put it on a liquid pair, let the yellow candles accumulate, and study which ones confirmed and which cancelled — the chart will teach you what a real cascade looks like faster than any thread ever will.
This article is for educational purposes only and is not financial advice. Leveraged trading carries substantial risk of loss. Always do your own research and never risk more than you can afford to lose.

Ready to automate your trading?
Connect your exchange, set up automations, and start trading smarter — all from one platform.
Start Trading Free