
Breakout Retest: Automatic Level-Flip and Retest Detection
How Crodl's Breakout Retest study finds a horizontal level, marks the decisive close that breaks it, and flags the return-and-reject retest — the flipped support/resistance entry, drawn only once it confirms.
Every trader has drawn this: a horizontal line across a level price kept bouncing off, and then watched, one candle, price close clean through it. The line that was resistance becomes support. Price pulls back, taps it from the other side, and rejects — and that retest is the entry the whole setup was waiting for. The pattern is textbook. The discipline to wait for the retest instead of chasing the break is where most of the edge lives, and where most of it is lost.
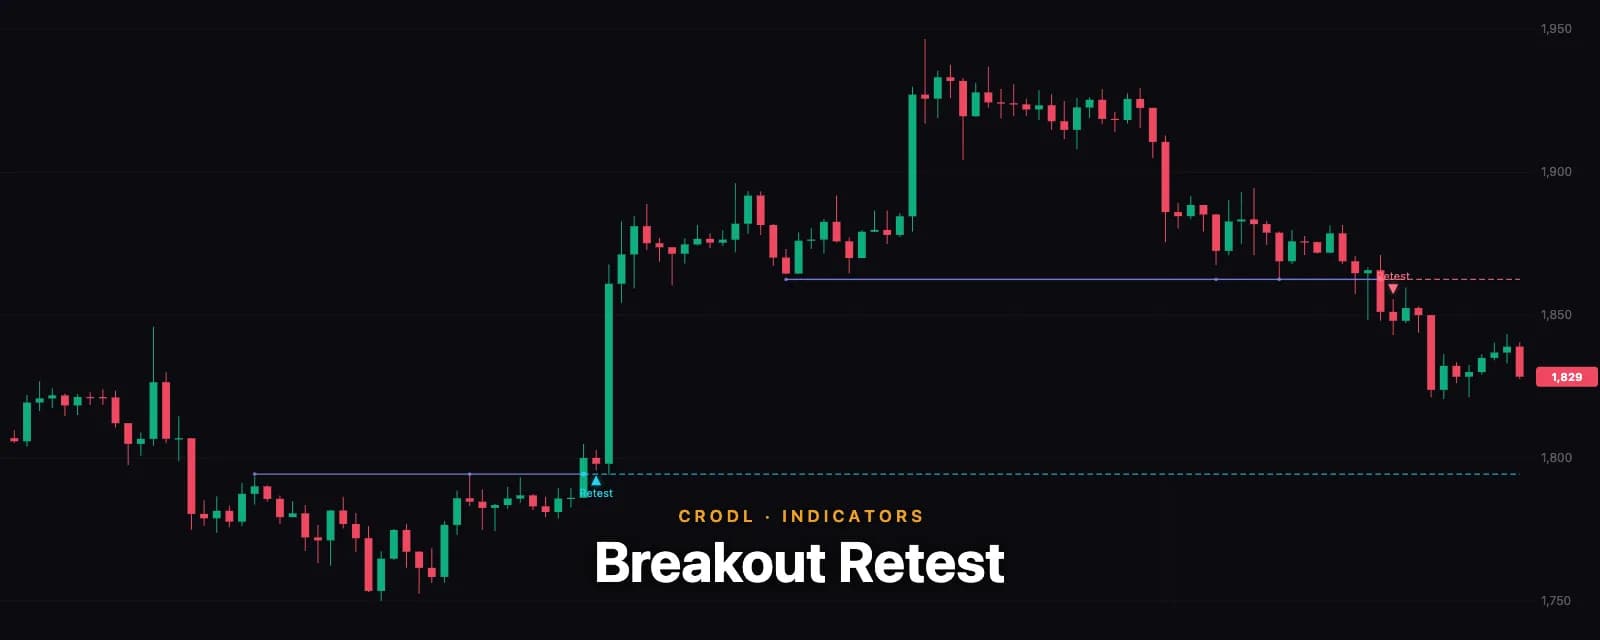
Breakout Retest on the Crodl terminal draws the whole sequence for you, mechanically, and — the part that matters — draws it only once it has happened. It finds the level, marks the decisive close that broke it, and flags the bar where price returned and rejected. Nothing appears on a hopeful, half-formed setup. Everything it draws already flipped and held.
What it shows
- The level — a horizontal line sitting on the wick it rejected from: the highest high for a resistance, the lowest low for a support, built from multiple swing touches. Solid while the level held.
- The break — a small dot where a candle closed decisively through the level. From there the line turns dashed and continues in the flip colour, so a former resistance that broke up now reads as fresh support (and vice versa).
- The retest — an emphasized marker and label on the bar where price came back, tapped the flipped level from the new side, and closed back in the breakout direction. That rejection is the signal.
Bullish flips are cyan, bearish flips rose, the held level indigo — a deliberately distinct palette so the study reads as its own thing, not another orange line on a crowded chart.
How detection works on the Crodl terminal
- Swing pivots, confirmed only. A pivot is registered only after the bars to its right have closed — never retroactively — so the level is built from structure that was actually visible at the time.
- Cluster into levels, capped on the wick. Same-kind pivots within an ATR-scaled tolerance form a level; a level needs at least
Min touches(default 2). Its price caps the touch wicks — the highest high of a resistance, the lowest low of a support — so the line sits on the wick the way you would draw it, not through the middle of the range. - The breakout. After the level is established, the first candle that closes beyond the capped level by more than an ATR buffer is the break. A resistance only breaks up, a support only down — a dip through the level during formation is not a break.
- The retest. Within
Retest windowbars, the first bar that returns to the flipped level and closes back in the breakout direction is the retest. A close that reclaims the level (back through by the buffer) invalidates the flip first, so a failed break never masquerades as a retest.
Everything is anchored to the bars it came from and frozen at confirmation — pan, zoom, and new candles only re-project it. It does not repaint.
How traders use it
The retest entry
This is the study's whole reason to exist. Chasing the breakout candle means buying the top of an impulse with a wide stop; waiting for the retest means entering as the flipped level proves itself, with a stop just on the other side of the line. The study marks the exact rejection bar, so the setup and the trigger arrive together — and only when they actually occurred.
The flip as fresh support/resistance
A broken level does not disappear — it changes polarity, which is why the line continues (dashed) in the flip colour to the current bar. A resistance that broke and retested is now a support level to lean on for the next pullback; pairing it with a zone from Visible S/R or Liquidity Zones tells you which flips have real resting orders behind them.
Confluence with the trend
A bullish flip inside an Auto Channel up-channel, or a retest that lines up with a chart-pattern breakout, is the same continuation story told twice. When the level flip and the larger structure agree, the retest is as clean an entry as price action offers.
Settings that matter
- Swing length (default 5) — pivot sensitivity. Lower finds tighter, more numerous levels; higher keeps only major ones.
- Min touches (default 2) — how many swing touches make a level. Raise to 3 for only the most-tested lines.
- Level tolerance / Breakout buffer (× ATR) — how loosely touches cluster into one level, and how decisive a close must be to count as a break. Both scale with volatility.
- Retest window (default 40) — how many bars a flipped level stays armed for its retest.
- Require retest (default on) — only draw once the retest confirms. Turn it off to mark breakouts immediately, retest or not.
- Extend after break (default on) — draw the dashed flipped-level line onward to the current bar. Turn it off for a cleaner chart that shows only the held level and the retest marker.
- Colors — the indigo level, cyan bullish flip, and rose bearish flip are all editable.
An honest note
The confirmation-first design is the trade-off: you never see a false forming setup, but you see the retest only after it has printed, not while it is developing. Not every break gets a retest — price often just runs, and with Require retest on those simply aren't drawn (turn it off if you want the breakouts regardless). The level is capped on the wick, so a single anomalous spike can set it slightly higher or lower than where price mostly reacted — widen the touch tolerance or raise Min touches if a wick is placing a line where you don't believe it. And a retest is a probability, not a promise: a flipped level can fail on the second test as easily as it held on the first.
Frequently Asked Questions
How is this different from Visible S/R or Liquidity Zones?
Visible S/R shades the zones price is reacting to right now, and Liquidity Zones marks levels that get swept — both describe standing structure. Breakout Retest is event-driven: it only draws a level once it has broken and flipped, and its focus is the retest entry, not the zone itself.
Does it repaint?
No. Pivots are confirmed only after the bars to their right close, the level and its touches freeze at the breakout bar, and the retest is marked on the bar it rejects. Drawn events never move or vanish as new candles arrive.
Why is the level line on the wick instead of the average of the touches?
Because that is how a trader draws support and resistance — a resistance caps the highs it rejected from, a support floors the lows. Putting the line on the outermost wick means the level sits on the structure and the touches tuck under it, and it also makes the break stricter: the level "held" until a close cleared the highest rejection.
Can I turn off the dashed line after the break, or change the colours?
Yes. Extend after break toggles the dashed flipped-level projection, and the level, bullish-flip, and bearish-flip colours are all editable in the study's inputs.
What if the retest never comes?
With Require retest on (the default), a break that runs away without returning is simply not drawn — the study waits for the confirmation. Turn Require retest off to mark every confirmed breakout, with the retest marker added later if and when price comes back.
Wait for the retest
Breakout Retest is one click away in the indicator picker on every Crodl terminal chart. Put it on a ranging pair, and the next time a level breaks, let the study wait for the tap-and-reject instead of chasing the candle — the retest is where the line proves it flipped.
This article is for educational purposes only and is not financial advice. Leveraged trading carries substantial risk of loss. Always do your own research and never risk more than you can afford to lose.

Ready to automate your trading?
Connect your exchange, set up automations, and start trading smarter — all from one platform.
Start Trading Free