
Volume Bubbles: Bookmap-Style Buy/Sell Volume on Your Candles
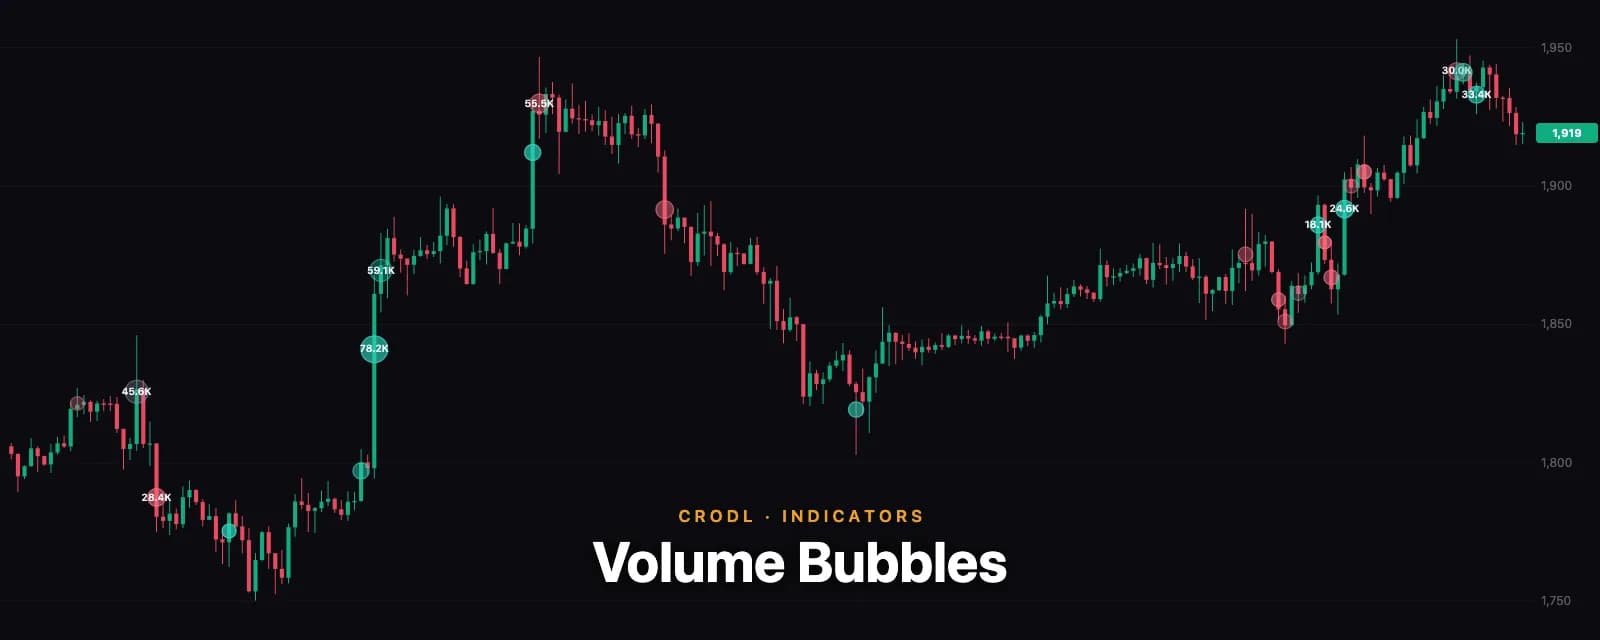
How Crodl's Volume Bubbles study spots unusually large prints with a rolling volume z-score and draws them as area-proportional bubbles coloured by estimated aggressor side — buys teal, sells rose.
Order-flow platforms like Bookmap made one idea famous: don't just plot volume in a pane at the bottom of the chart — put it on the price, sized by how big it was and coloured by who was hitting. A cluster of large buy bubbles into a falling market reads instantly as absorption; a giant sell print at a high reads as distribution. The information was always in the volume pane — the bubbles just make it impossible to miss.
Volume Bubbles on the Crodl terminal brings that reading to the candle chart. One bubble per unusually large closed candle, area proportional to how far above normal its volume was, coloured by the estimated aggressor side — buys teal, sells rose, balanced bars grey. Ordinary bars get nothing: the chart stays clean until something abnormal prints.
What it shows
- A bubble on every significant candle — "significant" meaning the bar's volume cleared a z-score threshold against a rolling baseline (default: 1.5 standard deviations above the last 60 bars). Ambient volume never draws.
- Area ∝ volume — the bubble's area scales with volume relative to baseline, the honest way to encode magnitude in a circle: a print with four times the baseline volume gets a bubble twice the radius. A pixel clamp stops one monster print from swallowing the chart.
- Colour = aggressor side — teal when buying dominated the bar, rose when selling did, grey when the bar was balanced. Opacity scales with how one-sided the bar was: a 90% buy bar draws hot, a 55/45 bar draws faint.
- Volume labels on the biggest prints — bars beyond the label threshold (default 3σ) print their volume inside the bubble, collision-avoided so dense clusters stay readable.
How detection works on the Crodl terminal
- Rolling baseline. Each bar's volume is compared to the mean and standard deviation of the previous
Baselinebars (default 60) — exclusive of the bar itself, so a spike can never inflate its own yardstick. - Z-score gate. A bubble is drawn only when the bar's volume z-score clears
Min z-score(default 1.5). This is what keeps the study quiet: roughly one bar in fifteen qualifies on typical crypto volume, and each one that does is genuinely abnormal for its own recent regime — the same setting behaves sensibly on BTC and on a small-cap alt. - Aggressor estimation. With candle data, the buy/sell split is estimated by where the bar closed in its range — a close at the high reads as buyer-dominated, at the low as seller-dominated. This is the same convention as the terminal's Buy Volume and Sell Volume studies, so the two always agree. When the data feed carries true taker-buy volume for a candle, the study uses it automatically instead of the estimate.
- Closed candles only. The forming bar is excluded — a bubble can never appear, grow, or change side mid-tick, and once printed it never moves. No repaint.
How traders use it
Absorption and exhaustion
The classic order-flow reads translate directly. Large buy bubbles printing into a decline that stops falling is absorption — someone is soaking up the selling. A giant bubble at the end of an extended run — the largest print in the move, often labelled — is climax volume, and what happens on the very next bars usually decides the trend.
Confirming breakouts
A breakout on a big teal bubble is a different trade from a breakout on ambient volume. Pairing this study with Breakout Retest puts both halves on one chart: the level that broke, and whether real size drove the break. The same logic applies to chart-pattern confirmations — a neckline break carrying a 3σ bubble has conviction behind it.
Mapping where size traded
Bubbles cluster at prices that matter. A shelf of large prints marks a level institutions cared about — which is frequently the same level Visible S/R shades or a Liquidity Zones sweep targets. When a fresh bubble prints into an old cluster, both studies are telling you the same level is active again.
Settings that matter
- Baseline (bars) (default 60) — the rolling window volume is judged against. Shorter adapts faster to regime changes; longer holds a steadier yardstick.
- Min z-score (default 1.5) — the significance gate. Raise to 2–3 to see only the truly exceptional prints; lower toward 1 for a busier, more sensitive chart.
- Label z-score (default 3) — how exceptional a print must be to get its volume written in the bubble.
- Max radius (default 26px) — the size clamp.
- Side — show buys and sells, buys only, or sells only.
- Colors — buy, sell, and balanced-bar colours are all editable.
An honest note
This is candle-resolution order flow, not tick data. Bookmap's bubbles plot every individual trade from the time-and-sales feed; on a candle chart, the study sees one volume number per bar and estimates the aggressor side from where the bar closed in its range. That estimate is well-established and right far more often than not, but a bar that closed high can still hide heavy selling inside — and the bubble sits at the bar's typical price, not at the exact tick where size traded. What survives the translation intact is the part that matters most: this bar carried unusual, one-sided volume at this price — absorption, climax, and conviction reads all still work. When true taker-buy data is available in the feed, the side colouring upgrades from estimate to fact automatically.
Frequently Asked Questions
How is this different from the volume pane?
Same data, different geometry. The volume pane shows every bar's volume at the bottom of the chart, and unusual prints are easy to skim past. Bubbles put only the abnormal prints on the price itself, sized so the eye ranks them instantly — you can't not see a 4σ print.
Does it repaint?
No. Only closed candles are scanned — the forming bar can never mint or resize a bubble — and each bubble's size and side are fixed from its own bar's final data. New candles can add new bubbles; they never change old ones.
How accurate is the buy/sell colouring?
It's an estimate from close position in range — the standard approximation when true aggressor data isn't in the feed, and the same one the terminal's Buy/Sell Volume studies use. Treat the colour as a strong hint and the size as fact: volume is measured, side is inferred. Where the feed provides real taker-buy volume, the study uses it instead.
Why does a huge candle sometimes get no bubble?
Two possibilities: the bar's volume was large in price terms but ordinary relative to the recent baseline (bubbles key on volume, not candle size), or there wasn't enough history yet — the study needs a full baseline window of closed bars before it can judge anything.
Can I see only the sell-side prints?
Yes — set Side to Sells only (or Buys only). Useful when you're tracking distribution into a rally or accumulation into a decline and want the opposing flow isolated.
Put the size where you can see it
Volume Bubbles is one click away in the indicator picker on every Crodl terminal chart. Add it to a pair you trade daily and let the chart go quiet — then, next time a bubble prints, you'll know someone with size just showed their hand.
This article is for educational purposes only and is not financial advice. Leveraged trading carries substantial risk of loss. Always do your own research and never risk more than you can afford to lose.

Ready to automate your trading?
Connect your exchange, set up automations, and start trading smarter — all from one platform.
Start Trading Free