
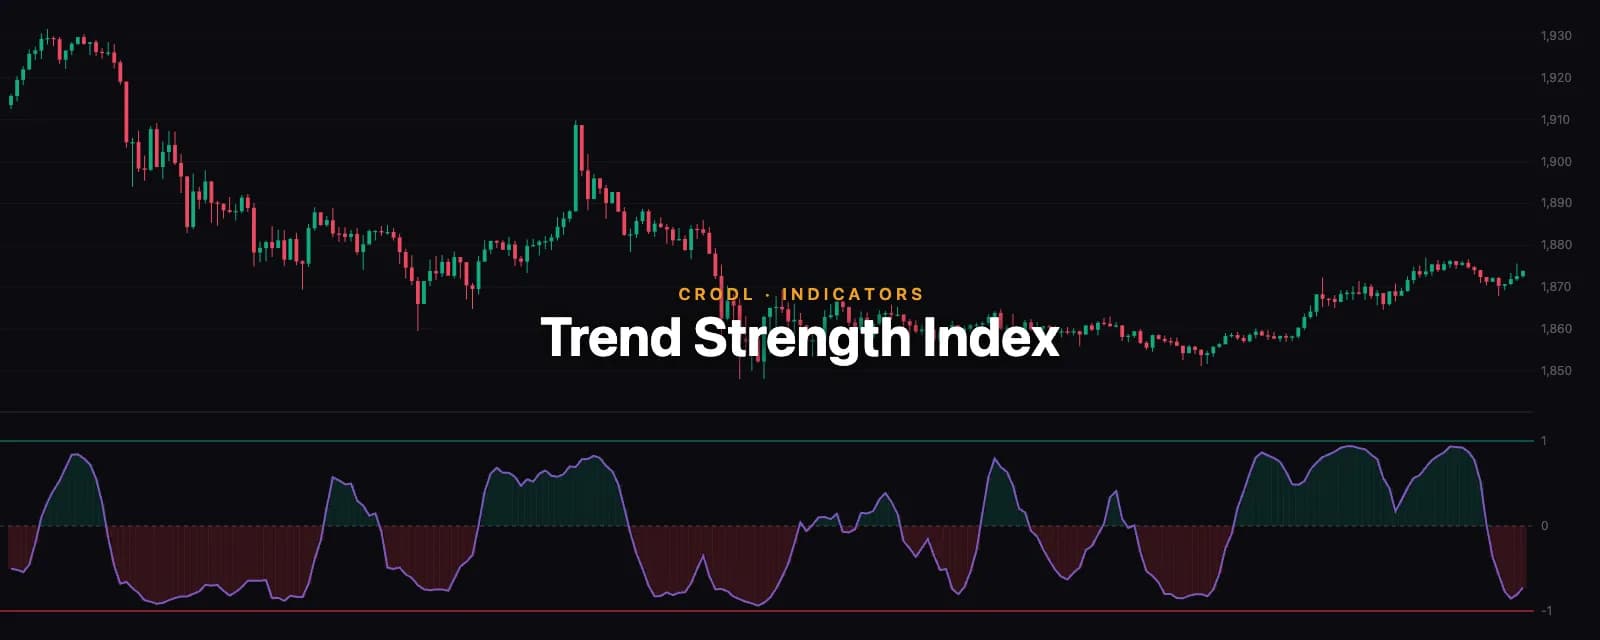
Trend Strength Index: Price-Time Correlation as a Trend Meter
How Crodl's Trend Strength Index measures the rolling Pearson correlation of price against time — +1 for a perfectly linear uptrend, −1 for a linear downtrend — with ±1 bands and zero-anchored fills.
Most trend oscillators measure momentum — how fast price moved. The Trend Strength Index measures something subtly different and often more useful: how orderly the move is. It is the rolling Pearson correlation between price and time itself over the last Length bars (default 14). A market grinding up in a straight line scores +1 whether it's climbing fast or slow; a straight-line decline scores −1; chop that goes nowhere scores near 0 — no matter how violent the individual bars.
That makes TSI a regime meter rather than a timing tool: it tells you whether the tape currently rewards trend-following or mean-reversion.
How it works
Each bar, the study computes the correlation coefficient between the closing prices of the last Length bars and their bar indices — literally "how well does a straight line through time explain price right now?"
- +1 — closes form a perfectly ascending line across the window.
- −1 — a perfectly descending line.
- ≈ 0 — no linear relationship: ranging, chopping, or reversing inside the window.
The computation runs on our own corr() engine — the same centered, two-pass Pearson formula as TradingView's ta.correlation, clamped to [−1, 1] — evaluated on closed candles with prior-bar warmup (Length − 1 bars of null before the first value). A window with zero price variance (a perfectly flat market) has no defined correlation and returns nothing, exactly like the original's na.
The display mirrors the classic: a violet TSI line, solid bands at +1 (bullish) and −1 (bearish), a dashed zero line, and translucent green/red fills anchored to zero so the regime reads at a glance.
How traders use it
Regime first, entries second
The most common use is as a filter in front of other tools: only take trend-following entries — flags, breakout retests, three-bar plays — while TSI holds beyond ±0.7-ish, and only take fade setups like Cascade Exhaustion when TSI is stretched at an extreme or crossing back toward zero. On real crypto tape at default length, roughly one bar in ten sits beyond ±0.8 — the zones are meaningful, not decorative.
The zero cross and the ±1 pin
A cross through zero marks the window flipping from net-down to net-up (or back) — a slow but robust trend-change confirmation. A reading pinned near ±1 for many consecutive bars is the signature of the strongest trends: corrections during such pins tend to be shallow and brief.
Divergence at the extremes
Price making a new high while TSI retreats from +1 means the advance is losing linearity — later highs are being bought more raggedly. It's the same logic as momentum divergence, but measured in orderliness rather than speed, and it frequently precedes range formation rather than outright reversal.
Settings
- Length (default 14, up to 500) — the correlation window. Shorter reacts faster and whipsaws more; 50+ turns it into a swing-regime meter.
- Timeframe (default Chart) — compute the correlation on a higher timeframe than the chart: sit on a 5m chart and read the 15m (or 1h, 4h…) trend strength. The whole correlation runs on resampled buckets of that timeframe — 14 fifteen-minute bars, not forward-filled chart bars — with closed-bucket visibility, so history never repaints and only the live bar tracks the developing bucket. The line steps once per higher-timeframe bar.
- Colors — the TSI line and both band/fill colors are editable.
Honest limitations
TSI is windowed and symmetric: it cannot distinguish a strong trend from a finished one until enough non-trending bars enter the window, so it lags at turns by design — read it as "what regime have we been in," not "what happens next." Its value is bounded but its meaning is relative: ±0.8 on a 14-bar window is common; ±0.8 on a 100-bar window is a market event. And like any single-series statistic, it says nothing about magnitude — a perfect +1 grind can still be too slow to out-earn fees.
Frequently Asked Questions
Does it repaint?
No. Each bar's value is the correlation of its own closed window; it never changes once printed.
Is this the same as TradingView's "Trend Strength Index"?
Yes — the same ta.correlation(close, bar_index, length) construction, reimplemented natively in the terminal's Rune engine with the same population-statistics formula, warmup behaviour, and na semantics on flat windows.
How is it different from ADX?
ADX measures directional movement magnitude through smoothed DM/TR ratios — it's unsigned and lags heavily. TSI is signed (direction is in the sign), bounded, and answers a geometric question: how straight is the line? They agree in strong trends and disagree instructively in fast-but-choppy conditions, where ADX rises and TSI stays modest.
What timeframe does it use?
The chart's own by default. Set the Timeframe input higher (e.g. 15m while charting 5m) and the correlation is computed on candles resampled to that timeframe from the loaded chart data — the honest, non-repainting version of Pine's request.security. Lower timeframes than the chart aren't available (they can't be derived from chart candles).
Measure the grind
Trend Strength Index is one click away in the indicator picker on every Crodl terminal chart, under Presets. Drop it beneath your chart, watch where the ±0.8 pins line up with your winners and losers, and let the regime pick the playbook.
This article is for educational purposes only and is not financial advice. Leveraged trading carries substantial risk of loss. Always do your own research and never risk more than you can afford to lose.

Ready to automate your trading?
Connect your exchange, set up automations, and start trading smarter — all from one platform.
Start Trading Free