
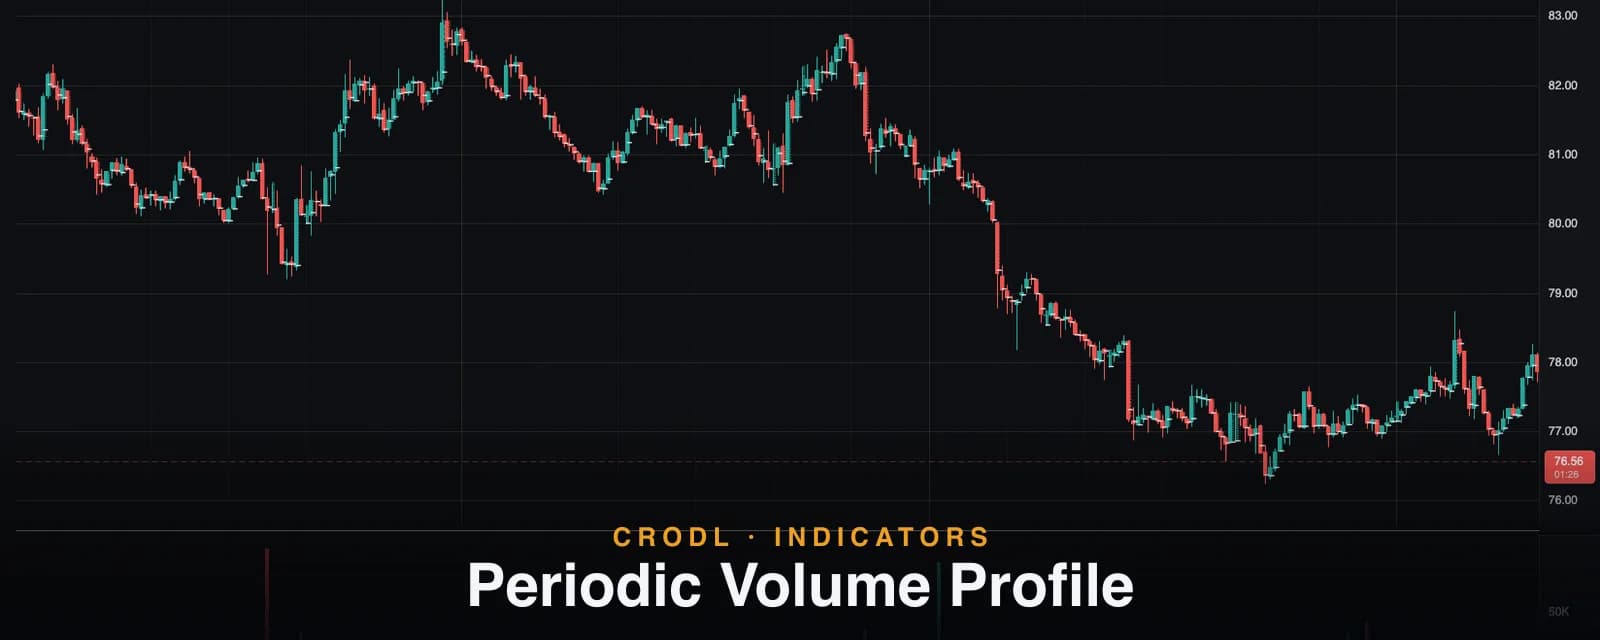
Periodic Volume Profile
Put a volume profile on every candle or session: Crodl's Periodic Volume Profile draws per-period POC and value area levels from a body-weighted estimate.
A visible-range volume profile answers one question: where did volume trade across everything on my screen? Useful — but it blends a month of trading into one histogram. Sometimes you want the opposite: where did volume concentrate inside this candle? Inside this session? Inside each week of the range you are trading?
The Periodic Volume Profile (PVP) on the Crodl terminal answers that. It draws a separate volume-at-price profile for every period on your chart — and the period is whatever you want it to be: every single candle (the default), every 4 hours, every day, every week. Each profile gets its own Point of Control and value area, so instead of one blended map you get a row of them, marching across the chart with the price action that built them.
The result reads like an X-ray of each candle or session: not just how much traded, but where in the range it traded — and that is often the difference between a breakout with acceptance and one running on air.
What it shows
At the default setting — Period 1, Period unit Bar — every candle grows its own mini-profile: a horizontal histogram spanning the candle's high–low range, with the highest-volume row (the POC) and a value area covering 70% of the candle's volume. Switch the period unit to Hour, Day, or Week and candles group into sessions, each session getting one profile built from all its candles — the same per-period logic as the TPO Profile, but weighted by volume instead of time.
Each profile can also draw its levels: the POC line (on by default), plus VAH and VAL (off by default), with per-line toggles to extend any of them to the right edge of the chart — which is how a session POC becomes a standing reference level for everything that follows.
How it works on the Crodl terminal
Add Periodic Volume Profile from the indicator picker. For each period, the price range is split into rows (Row size, default 24, adjustable 8 to 160) and every candle's volume is distributed across the rows its range overlaps. Two mechanics matter:
Body weighting. A single OHLCV candle carries no intrabar detail — spread its volume uniformly and every per-candle profile would be a flat rectangle with no POC. Instead, PVP weights the distribution toward the open–close body, where price demonstrably spent most of its time: body rows receive triple the weight of wick rows per unit of price, while total volume is conserved exactly. A POC emerges where the body sat, wicks stay thin.
Up/down split. With Volume set to Up/Down (the default), each row splits by candle direction — close at or above open counts as up. One honest consequence: at the 1-bar period a candle is entirely up or down, so each per-candle profile is single-colored. The split becomes genuinely informative at multi-candle periods, where a session mixes both. A Total mode is available if you prefer one color.
The rest of the settings: Value Area Volume % (default 70, range 30–95), Extend POC/VAH/VAL right toggles, Width (% of box) controlling how far profiles extend into each period's span (default 30), Placement (Left by default, or Right), show toggles for the profile, POC, VAH, and VAL, plus colors for up/down volume, value-area rows, POC and VA lines, and Line width (default 1.2).
| Tool | Weights prices by | Scope | Best for |
|---|---|---|---|
| Periodic Volume Profile | Volume (body-weighted estimate) | Every candle / fixed period | Per-candle and per-session structure |
| Volume Profile (VPVR) | Volume (proportional) | Whatever is on screen | The visible range's overall map |
| TPO Profile | Time at price | UTC day / week / month | Auction shape, balance vs imbalance |
How traders actually use it
Retest the impulse candle's POC
When a large impulse candle breaks a level, its POC marks where the bulk of that volume was positioned. A pullback to that POC is a retest of the breakout buyers' average ground — a classic entry with a stop below the candle's value area. This works especially well when the impulse candle also fills or creates a fair value gap at the same price.
Trade session profiles with extended POCs
Set Period unit to Day and enable Extend POC right: every daily POC now projects forward as a horizontal level. Untested POCs from prior sessions act as magnets and reaction levels — a compact way to build the "naked POC" map without a full market-profile workflow.
Read a breakout candle's anatomy
On a session profile (4 Hour or Day), where the POC sits inside the range tells you who won: a POC near the top of an up move means volume followed price and accepted higher values; a POC stuck at the bottom means the rally happened on thinning participation. The first supports continuation, the second argues for the fade.
An honest note on the estimate
PVP's per-candle distribution is an OHLC estimate, not true intrabar data. Real volume-at-price inside a candle requires lower-timeframe (or per-trade) data that is not available client-side — 1-minute candles are the floor. The body-weighted model is a principled stand-in: it concentrates volume where price spent its time, conserves totals exactly, and at multi-candle periods the estimate error washes out across bars. Treat single-candle POCs as good approximations, and session-level POCs as robust.
Frequently Asked Questions
Is this real intrabar volume data?
No — and PVP does not pretend it is. Each candle's volume is spread across its range with triple weight on the open–close body. The profile shape within one candle is an estimate; totals, and profiles built from many candles, are exact aggregations of real volume.
Why is each 1-bar profile a single color?
Because one candle is entirely up or down by direction. Use a period greater than one bar (or a time unit) to see the up/down mix, or switch Volume to Total.
How is this different from VPVR?
VPVR builds one profile from whatever is visible and rebuilds it as you pan. PVP builds one profile per fixed period, anchored to the bars that created it — the profiles stay put as you scroll.
Why do the profiles disappear when I zoom way out?
Profiles narrower than a few pixels are skipped — at that zoom they would render as noise. Zoom in, or increase the period so each profile spans more bars.
Put a profile on every candle
The Periodic Volume Profile is one click away on every Crodl terminal chart — add it from the indicator picker, pick your period, and every candle or session carries its own POC and value area, alongside live trading on six exchanges.
This article is for educational purposes only and is not financial advice. Leveraged trading carries substantial risk of loss. Always do your own research and never risk more than you can afford to lose.

Ready to automate your trading?
Connect your exchange, set up automations, and start trading smarter — all from one platform.
Start Trading Free