
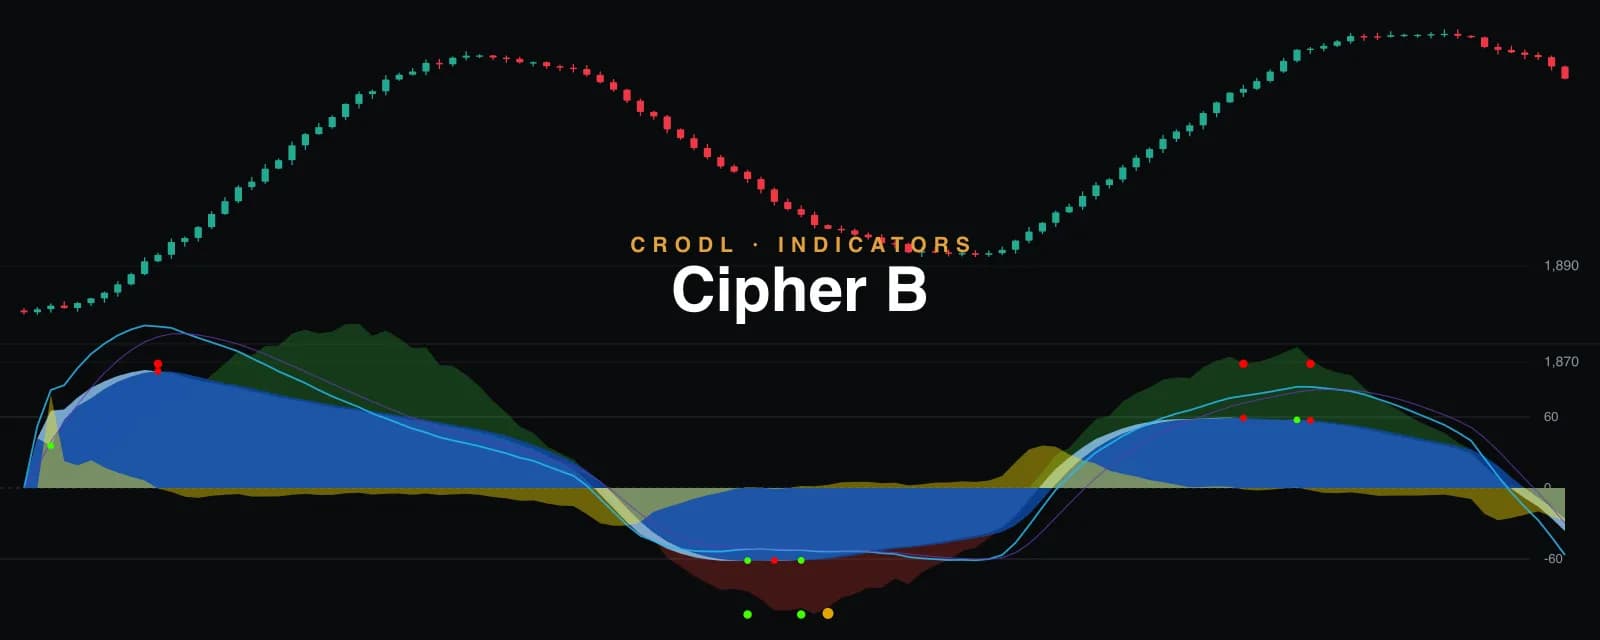
Cipher B: The Full VuManChu Suite in One Pane
How Crodl's Cipher B preset ports the open-source VuManChu Cipher B Divergences — WaveTrend waves, buy/sell/gold dots, RSI+MFI money flow, Stochastic RSI and the fractal divergence engine — natively into the terminal, with server-verified alerts.
Some indicators are tools; Cipher B is a dashboard. The community-built VuManChu Cipher B Divergences — the open-source rebuild of Market Cipher B on LazyBear's WaveTrend — packs a market's momentum, money flow and divergence state into one pane, read through a famous vocabulary of dots. It's now a native preset on the Crodl terminal, and because it runs on our Rune engine on both the chart and the alert worker, every dot can also be a server-side alert.
The components
- WaveTrend waves — the heart. Two smoothed momentum waves (light blue over dark blue) oscillating through overbought/oversold bands at ±53/±60. Every crossing prints a small circle: green when the waves cross up, red when they cross down.
- The fast wave (yellow) — the gap between the two waves, the earliest hint that momentum is turning before the crossing itself.
- RSI+MFI money flow — the green/red area behind everything: candle-body pressure smoothed over 60 bars. Green above zero says buyers are paying up; red says distribution — plus the thin money-flow bar pinned to the pane's bottom edge.
- Stochastic RSI — the K/D ribbon (default on a log price scale, exactly like the original) weaving through the pane for timing within the wave.
- Schaff Trend Cycle and a classic RSI line — both included, both off by default, as in the Pine.
The dot vocabulary
- Small green/red circles — every WaveTrend cross. Information, not signals.
- Big green dot (bottom of pane) — waves crossed up while oversold (wt2 ≤ −53). The classic "buy circle".
- Big red dot (top) — waves crossed down while overbought. The "sell circle".
- Divergence dots — a bullish or bearish divergence registered on WaveTrend (either range), and optionally RSI or Stoch when you enable their engines.
- Gold dot — the famous one: a bullish divergence whose previous wave-low sat below −75, with RSI under 30 — the deep-flush setup. In the original's own words: don't blindly buy it; it marks maximum stress, not a guaranteed floor.
The divergence engine
Faithful to the VuManChu construction: a 5-bar fractal confirms a wave pivot two bars after it forms, and each new pivot is compared against the previous one (valuewhen) — higher price high on a lower wave high is bearish divergence; lower price low on a higher wave low is bullish. Two ranges run in parallel (the strict ±45/−65 gates and the wider 15/−40 "second range", drawn darker), and the RSI and Stochastic engines are one toggle away. Everything computes on closed bars — dots never appear early and never vanish.
Alerts, server-side
This is where the native port pays off: the same script runs in the backend alerts worker, verified value-for-value against the chart runtime. Alert on the big buy/sell circles, the gold dot, divergence signals, or every small cross — and it fires whether your chart is open or not.
Settings
All the Pine's knobs, grouped: WaveTrend lengths (9/12/3), the OB/OS band levels, both divergence ranges with their gates, money-flow period/multiplier/offset, Stochastic RSI (log scale, K/D smoothing, optional K-D averaging), Schaff TC, per-dot visibility toggles, and the wave colours.
Honest limitations
It's a reading instrument, not a strategy: the original's author said it plainly, and it stays true here — the dots are information that needs price context (the terminal's Pivot Levels and Profile Shapes pair naturally). Three default-off extras from the Pine are not ported: hidden divergences, the Sommi flags/diamonds (higher-timeframe heikin-ashi patterns) and the HTF-MACD wave colouring. And divergence marks draw on the bar where the divergence confirms — two bars after the fractal it references, which is when it became knowable.
Frequently Asked Questions
Is this Market Cipher B?
It's a faithful port of VuManChu Cipher B Divergences, the open-source (MPL 2.0) community rebuild that imitates Market Cipher B — WaveTrend core, money flow, stoch, divergences, and the dot system. Credit to vumanchu, LazyBear (WaveTrend) and the TradingView authors acknowledged in the original.
Does it repaint?
No. Everything evaluates on closed candles; fractal divergences confirm two bars after the pivot and then never change. The forming bar develops honestly and settles at its close.
Which timeframe?
The original was tuned on 4h (its divergences are strongest there, per its author) and reads well on 1h–4h. On low timeframes the dots get dense — that's the indicator, not a bug.
Can I alert on the gold dot?
Yes — every signal (buy/sell circles, gold, divergence buys/sells, small crosses) is a declared alert, evaluated server-side by the same verified engine.
One pane, the whole story
Cipher B is live in the indicator picker on every Crodl terminal chart, under Presets. Drop it below your chart, learn the dot vocabulary, and let the waves tell you when to pay attention — then let the levels tell you what to do about it.
This article is for educational purposes only and is not financial advice. Leveraged trading carries substantial risk of loss. Always do your own research and never risk more than you can afford to lose.

Ready to automate your trading?
Connect your exchange, set up automations, and start trading smarter — all from one platform.
Start Trading Free