
Profile Shapes: P, b and D Structure Boxes, Drawn For You
How Crodl's Profile Shapes (PBD) indicator auto-detects consolidations and draws them as P, b or D structure boxes — the pole that built each box included — plus an alternate mode that classifies per-period volume profiles.
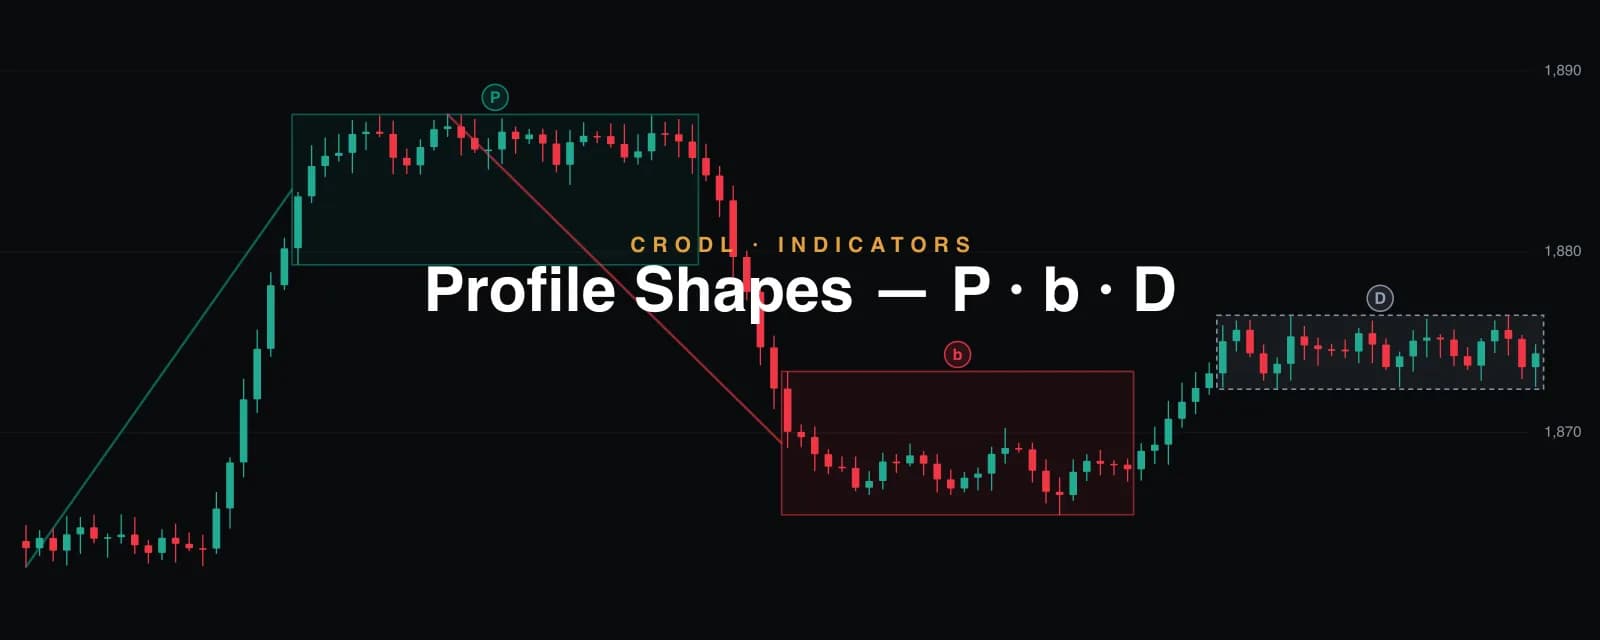
Every trader draws the same three pictures by hand: price runs up and stalls — a box around the chop at the top (that's a P, literally drawn on the chart: pole plus loop). Price dumps and stalls — box at the bottom (b). Price just churns sideways — a plain box (D). Profile Shapes (PBD) draws them for you: it auto-detects every consolidation, classifies it by the pole that preceded it, and puts the tinted box — pole line included — on the chart.
Structure boxes (the default)
- Detection: a range confirms when the closes of
Min bars in rangeconsecutive bars (default 15) all fit inside a band of 1.5×ATR. Closes, not wicks — consolidation is where the market repeatedly settles, and a single stop-run wick shouldn't veto it. The box bounds freeze at confirmation as the founding window's full wick extent, extend right while closes stay inside, and freeze for good on the first close beyond either edge. - Classification by pole: the indicator looks back up to 30 bars before the box. An up-move of at least the box's own height (default 1×) that dominates any down-move → P (teal). The mirror → b (rose). No dominant pole → D (silver). The pole line is drawn from its extreme into the box, so the chart shows why the box earned its letter.
- Lifecycle honesty: the letter is fixed the moment the box confirms — the pole is already history — and never changes. An active box (dashed border) grows rightward as new bars close inside it; that's honest development of the newest object, not a repaint. Frozen boxes never move.
How traders read them
- P after an up-pole — the market earned a level and is deciding whether to keep it. In an uptrend, the box top breaking is continuation; the box bottom breaking after a long run reads as distribution.
- b after a down-pole — the flush found a shelf. Uptrend context: leverage cleared, watch the box top. Downtrend: sellers resting before the next leg.
- D with no pole — pure balance. No edge inside; the edge is the break, and the box edges are the trigger prices.
- The boxes pair naturally with Pivot Levels (a box top sitting on a pivot level is a defended trigger) and with Volume Bubbles on the breakout bar.
Period profiles (the alternate mode)
Switch Mode to Period profiles for the auction-theory read: the chart is bucketed into higher-timeframe periods (Auto: 4h on ≤5m charts, daily on ≤1h, weekly above), each completed period's volume-at-price histogram is built with the same body-weighted spread as our Periodic Volume Profile, and a letter badge classifies it — P (volume node high, thin tail below: short covering), b (node low: long liquidation), D (symmetric balance) or B (double distribution: two nodes and a thin valley that price tends to revisit). Bimodality is tested before skew, only completed periods classify, and Mini profiles draws each histogram tinted by its class so every badge can be audited at a glance.
Settings
- Mode — Structure boxes (default) or Period profiles.
- Boxes — min bars in range, close band (×ATR), pole ≥ ×box-height, pole lookback, boxes kept, pole-line toggle.
- Profiles — period (Auto/1h…1W), rows, value-area %, POC skew / tail / valley thresholds, mini profiles, boundaries.
- Style — letter badges and the shape colours (P teal / b rose / D silver / B amber), shared by both modes.
Honest limitations
Box detection is settlement-based: a consolidation that never produces 15 in-band closes (violent chop) won't box, and the founding window can legitimately include the pole's last bar or two — the same thing your hand-drawn box does. The pole classification is geometric context, not a prediction: a P documents that an up-move stalled here, and what that means still depends on where it printed. In profile mode, per-row volumes are OHLC estimates rather than tick data — robust for shape, approximate in detail.
Frequently Asked Questions
Does it repaint?
No. A box's bounds and letter freeze at confirmation; only its right edge extends while it's still active (drawn dashed to say so), and the first close beyond an edge freezes it permanently. In profile mode, only completed periods are ever classified.
Why did a box appear 15 bars after the consolidation started?
Because that's when it became knowable — the detector needs the full founding window of in-band closes before a range exists at all. The box is drawn back over its founding window once confirmed.
What's the difference from Range Boxes?
Same detection family, different question. Range Boxes is direction-neutral — a box plus a breakout marker. Profile Shapes adds the context that auction traders actually read: what built the box (pole up, pole down, or nothing), coloured and lettered accordingly, plus the whole volume-profile classification mode.
Which mode should I use?
Structure boxes for trading the chart in front of you — it hugs the actual consolidations. Period profiles for a session-review habit: fixed periods, letter per period, like reading the day's market profile.
The picture you were drawing anyway
Profile Shapes (PBD) is live in the indicator picker on every Crodl terminal chart. Add it and the P's, b's and D's you've been sketching by hand appear on their own — poles, boxes, letters and all.
This article is for educational purposes only and is not financial advice. Leveraged trading carries substantial risk of loss. Always do your own research and never risk more than you can afford to lose.

Ready to automate your trading?
Connect your exchange, set up automations, and start trading smarter — all from one platform.
Start Trading Free