
Range Boxes: Automatic Consolidation Detection That Doesn't Repaint
Automatic consolidation-range boxes for crypto charts — how a range confirms inside an ATR band, why the box edges freeze, and how closing-bar breakouts fire.
Markets spend most of their time going nowhere. Between every trend leg sits a consolidation — a stretch of bars where price repeatedly settles around the same value while both sides build positions — and the levels bounding that stretch are among the most tradeable on any chart: fade the edges while the range holds, or trade the resolution when it finally breaks. The problem is drawing them. Hand-drawn boxes are subjective, drawn late, and quietly redrawn after every wick that embarrasses them.
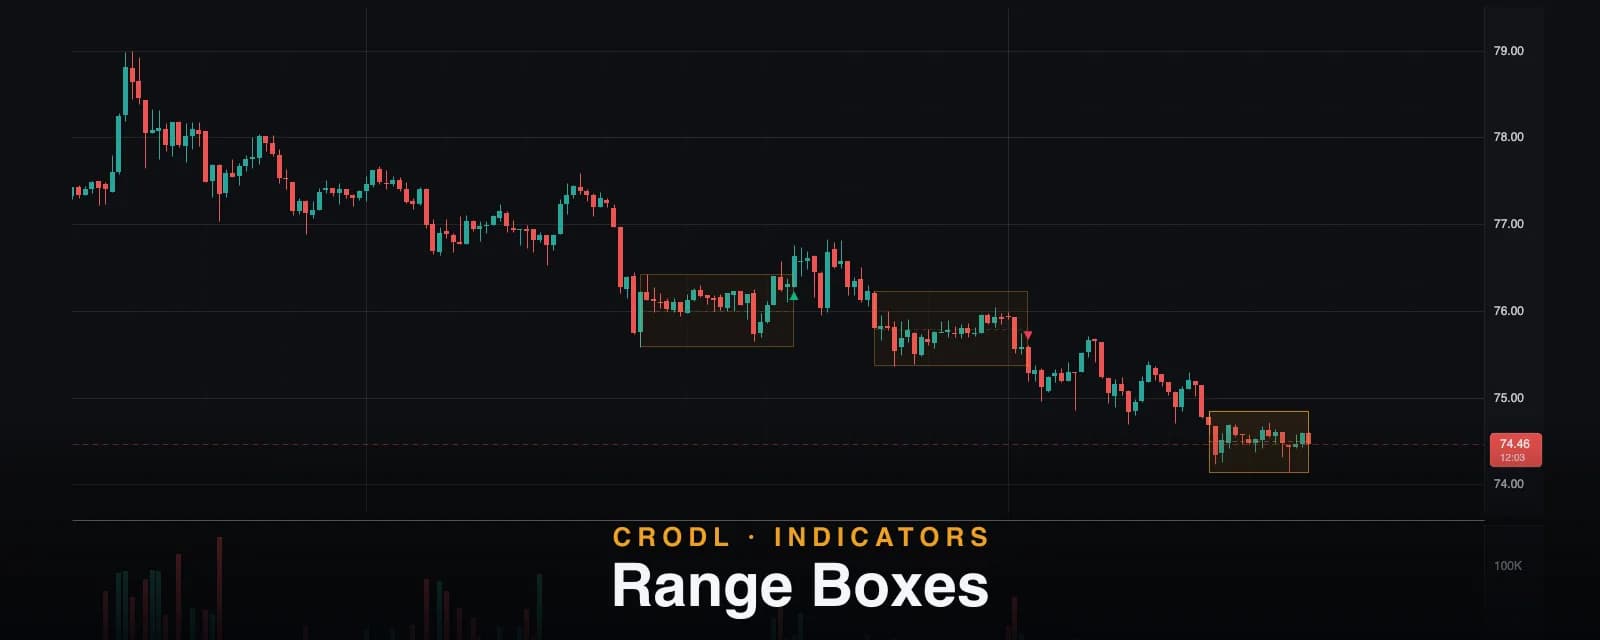
Range Boxes on the Crodl terminal automates the whole lifecycle. It watches closing prices, confirms a consolidation the moment the last 15 closes settle inside a volatility-scaled band, draws a box around those bars, extends it right while price keeps closing inside, and stamps a triangle on the bar whose close finally escapes. Every decision happens on closed bars, so the history you scroll back through is exactly what you would have watched print live.
How a range confirms
Detection uses closes, not wicks. A range confirms when the closes of the last Range length bars (default 15) all fit inside a band of height Range height × ATR — by default 1.5 × ATR(14).
Why closes? A consolidation is where the market repeatedly settles — a single stop-run wick spiking out of an otherwise dead-flat region should not veto the range. Basing detection on closes keeps one violent wick from hiding a genuine consolidation.
Once the window qualifies, the box is drawn around the full extent of the founding bars — top at the highest high, bottom at the lowest low — so it visually contains its candles, wicks included. A dashed mid-line marks the range's midpoint, and the box begins extending to the right.
The defaults are deliberately strict: at 1.5 × ATR, trending data never gets boxed and pure noise only occasionally qualifies. Loosen Range height toward 2.0 and the detector starts boxing every pause; tighten it below ~1.2 and it starts missing real consolidations.
The edges freeze — and that is the point
The design decision that separates Range Boxes from naive detectors: the top and bottom are frozen at confirmation. While later closes stay inside, the box only extends rightward; wicks that poke beyond the edges are drawn poking out and never ratchet the box bigger.
The rationale is trader-first: the box edges are the breakout levels you are actually watching. If every sweep expanded the bounds, the box would balloon and the trigger you planned around would retroactively move — a repaint in spirit. With frozen bounds, a wick jutting out reads exactly as it should: a sweep of the range boundary that failed to close beyond it — a probe into the resting liquidity that Equal Highs & Lows marks.
Breakouts fire on the close
A box breaks on the first closed bar whose close lands strictly beyond the frozen top or bottom — a close exactly at the edge still belongs to the range. At that moment the box freezes at the breakout bar, and a triangle marker prints: teal below the bar for an upside break, rose above it for a downside break.
Two honesty rules govern this:
- The forming bar decides nothing. A live candle can trade beyond the edge for twenty minutes, then close back inside. Deciding on closed bars only means that head-fake never prints a marker that later vanishes. The active box still visibly extends under the forming candle — development, not a decision.
- Detection re-arms after a break. The next range may only confirm from 15 completely fresh bars after the breakout bar, so a new box never re-forms out of the same bars that produced the break.
Only the most recent boxes are kept (default 3 — the active one plus recent broken ones), with broken boxes fading so the live range stays visually dominant.
| Chart element | What it means |
|---|---|
| Amber box, bright border | Active range — closes are still settling inside the frozen bounds |
| Wick poking outside the box | Liquidity sweep of the boundary that failed to close beyond it |
| Dashed mid-line | Range midpoint — the mean-reversion magnet inside the box |
| Teal triangle below a bar | That bar closed above the top — upside breakout, box frozen |
| Rose triangle above a bar | That bar closed below the bottom — downside breakout, box frozen |
| Faded box | A previous, already-broken range kept for context |
How traders use it
Fade the edges while the range holds
Inside a confirmed box, the classic play is mean reversion: buy tests of the bottom, sell tests of the top, target the dashed mid-line. Because the bounds are frozen, your invalidation is unambiguous — a close beyond the edge, not a wick through it.
Trade the break, not the wick
The breakout marker is deliberately conservative: it waits for a closing bar. That costs a few points versus an intra-bar trigger, but it filters the most expensive mistake in range trading — buying a sweep that immediately reverses.
Read sweep-then-break sequences
A wick out of the bottom followed a few bars later by a close out of the top is a textbook liquidity sequence: stops below get collected, then the market resolves the other way. Frozen bounds keep both events legible on one object, and confluence with a Visible S/R zone at the box edge strengthens either read.
Settings that matter
- Range length (bars) (default 15) — how many consecutive closes must fit the band. Longer = fewer, higher-quality ranges.
- ATR length (default 14) — the volatility lookback for the band.
- Range height (x ATR) (default 1.5) — the band multiplier. The main sensitivity dial: higher boxes more pauses, lower demands tighter compression.
- Max boxes (default 3) — how many recent boxes stay on the chart.
- Mid-line (default on) and Breakout markers (default on) — each toggles independently.
- Box / Breakout up / Breakout down colors and Opacity (default 100).
An honest note on lag
Confirmation is late by construction: a range only confirms after 15 closes have already fit the band, so the box appears when the consolidation is 15 bars old. Likewise the closing-bar breakout rule prints the marker only at the close, after some of the move has happened. Both are deliberate trades: you give up earliness and receive signals that never un-happen. And Range Boxes will never box a strong trend — no boxes means the market is not consolidating at this multiplier, not that the detector is broken.
Frequently Asked Questions
Why do wicks stick out of the box?
Because the bounds freeze at confirmation. Wicks beyond the edges are drawn poking out on purpose — they are sweeps of the boundary, and letting them expand the box would move the very breakout level you were watching.
Why did the breakout marker only appear when the candle closed?
Range Boxes decides on closed bars only. A live candle beyond the edge can still close back inside, and acting on it would paint markers that later vanish. The marker prints the moment the bar completes.
Why isn't an obvious range getting boxed?
Three usual reasons: the closes have not yet fit inside the band for 15 straight bars (wicks can look compressed while closes are not), the detector is still in its re-arm window after a recent breakout, or the range is taller than the multiplier allows. Loosening Range height (x ATR) boxes more — at the cost of more noise.
Does the box repaint?
No. Confirmed history never changes: frozen bounds, start bars, and breakout markers of past boxes are immutable. The only live behavior is the active box extending rightward and the marker appearing on a breakout close — honest development, not revision.
Put a box around the chop
Range Boxes is live on every Crodl terminal chart — add it from the indicator picker and the ranges (and their breakouts) mark themselves.
This article is for educational purposes only and is not financial advice. Leveraged trading carries substantial risk of loss. Always do your own research and never risk more than you can afford to lose.

Ready to automate your trading?
Connect your exchange, set up automations, and start trading smarter — all from one platform.
Start Trading Free