
Pivot Levels: Multi-Timeframe Pivots as Managed S/R Levels
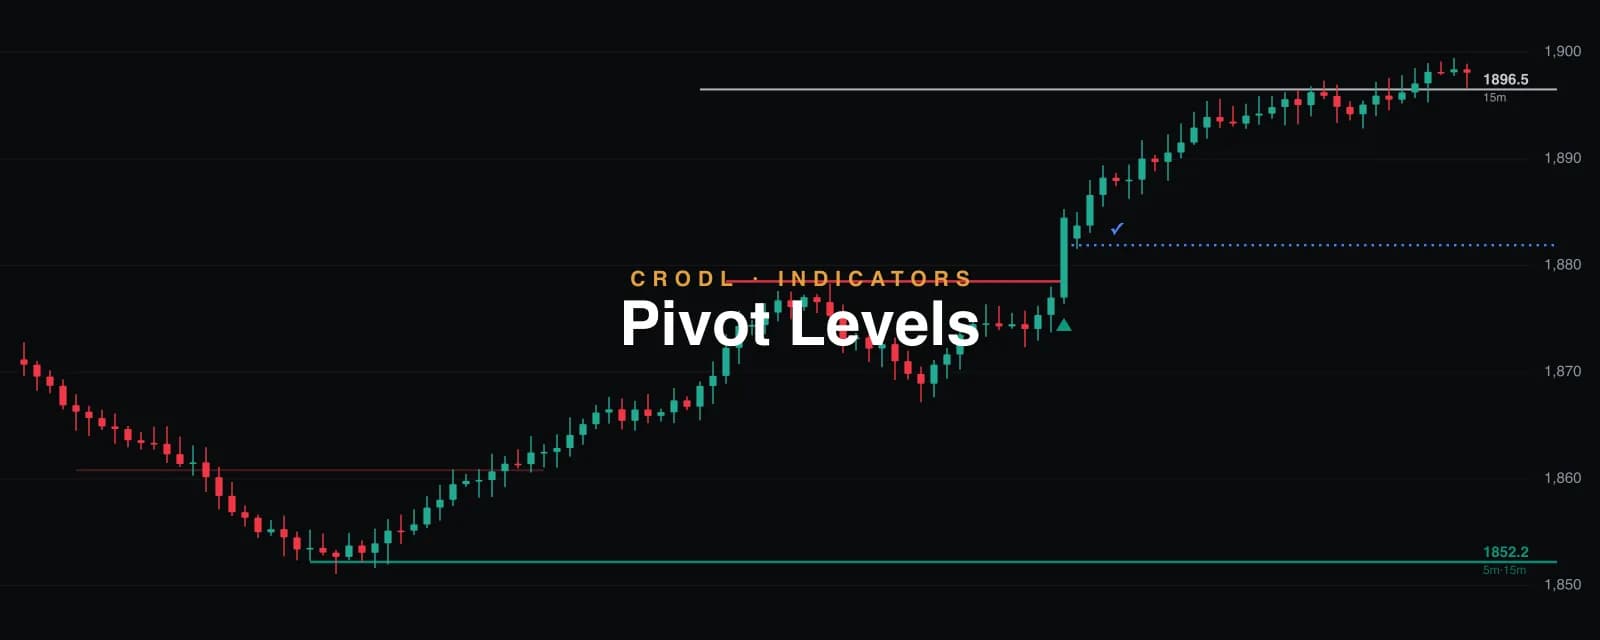
How Crodl's Pivot Levels indicator turns swing pivots from up to three timeframes into managed horizontal levels — spacing merge, cross-timeframe confluence, wick-adjust on failed breaks, breakout arrows, and a dotted ATR entry-confirmation line.
Most pivot indicators stop at detection: find the swing, draw the line, move on. Pivot Levels starts there. It detects confirmed turning points on up to three timeframes at once — your chart timeframe plus two higher ones — and then manages every level for its whole life: de-clutters by spacing, tags cross-timeframe confluence, moves a level to the new wick when a breakout fails, fires an arrow when price finally closes through, and only retires the line once the market has genuinely decided. The value is the lifecycle, not the signal.
How it works
Three timeframes, one map
The chart timeframe finds turning points with your choice of three detectors (more below). Timeframe 2 and 3 (defaults 5m and 15m) resample the loaded candles into higher-timeframe buckets and run classic confirmed-pivot detection on them — registered on your chart exactly when a closed higher-timeframe bar would have revealed them, never earlier. History and live bars print identically; nothing repaints.
Each timeframe owns a colour (red / teal / silver by default), so a glance tells you whose level price is respecting. With Merge levels across timeframes off — the default — aligned levels stack, and three lines at one price is itself the signal. Switch it on and they collapse into a single line tagged with every contributing timeframe (e.g. 5m·15m), optionally drawn thicker.
The break lifecycle
This is the part hand-drawn levels can't do consistently:
- Spacing merge — a new pivot within the minimum spacing (default 2×ATR) of a live level joins it instead of adding a near-duplicate line.
- The arrow and the line are separate events. The breakout arrow fires on the first close beyond the level plus a buffer (default 0.15×ATR). The line is only removed after three consecutive closes beyond — a close back inside resets the count and keeps the level alive. One close through is a poke; three is a decision. An optional Alternate arrows toggle keeps exactly one arrow per side — up, down, up, down — suppressing same-direction repeats until the other side fires.
- Failed breaks feed the level. If price wicks through but closes back inside, the level isn't deleted — it moves to the new wick extreme, so lines track the true rejection point instead of dying on every stop run.
- Nearest-N visibility — only the closest N levels above and below price are drawn (default 3 per side). Everything else stays tracked and can still break; this decides what you look at, not what exists.
- Levels also expire on a timer (default 60 minutes, 0 = never), optionally at each new UTC day, and under a hard cap.
The entry line
The workflow the indicator encodes: signal → wait → strong push-through → enter. On a break, a dotted blue line is projected beyond the broken level (default 0.5×ATR). Price must drive through it by a further 0.25×ATR — touching is not enough — before the setup counts as confirmed, marked with a ✓. A line that isn't taken out within 10 bars disappears: the setup is dead. Never enter on the signal candle itself.
Chart-timeframe detectors
- Structure (HH→LH) — the default. A resistance is identified at the peak of a series of higher highs, precisely where a lower high forms (mirrored for supports). One-bar confirmation, so levels appear almost immediately.
- Confirmed pivot — the classic ±N swing pivot. Exact, but a pivot cannot be known until N bars print after it, so it registers late by construction.
- Slope turn — a short smoothed slope flipping sign. Prints the moment the bar closes, with the level placed at the swing window's extreme; occasionally calls a one-bar blip a turn.
None of the three repaints — each registers on closed bars only and never retroactively.
Extras
- High-volume candles (off by default) — outline or repaint any candle whose volume is at least 2× its rolling average; a break with a high-volume candle carries more information than one without.
- ATR panel — a corner readout of the current ATR with optional low/high thresholds: below the low band the tape is too quiet for price to travel between levels; above the high band, size down and widen stops.
How traders use it
- Trade the chart TF, respect the higher ones. The default wiring takes arrows and entry lines from chart-timeframe levels only, while 5m/15m levels stay on screen as context — the reference workflow. Both can be widened to all timeframes.
- Confluence first — a level tagged
5m·15m, or two stacked lines with merge off, has been defended on multiple horizons. Breaks of those levels are the events worth the alert. - Pair the break with volume — a breakout arrow on a high-volume candle into clear space reads very differently from a quiet poke into the next level overhead.
- Confluence with other tools — a Pivot Level holding where a Breakout Retest flip or a Liquidity Zone sits is the same structure confirmed through independent lenses.
Honest limitations
Levels are inference, not order flow: a line at a swing extreme says price turned there once or twice, not that resting liquidity guarantees it turns again. The removal rule (three consecutive closes) deliberately trades speed for stability — a level can look "already broken" for two bars before the line concedes. Wick-adjust keeps levels honest through stop runs but means a level's price can drift upward/downward over its life; that is the design, not a bug. And on very quiet tape the ATR-scaled spacing tightens, so more distinct levels survive — the nearest-N filter is what keeps the chart readable there.
Frequently Asked Questions
Does it repaint?
No. All three chart-TF detectors and the higher-timeframe pivots register on closed bars only, and higher-timeframe pivots wait for their confirming bucket to complete before they exist at all. Arrows land on the closed bar that broke the level and never move.
Where do the higher-timeframe pivots come from?
The loaded chart candles, resampled into 5m/15m (or any timeframe you pick, up to 1W) buckets client-side — the honest, non-repainting equivalent of Pine's request.security with confirmed bars. A slot must be strictly higher than the chart timeframe, otherwise it would just duplicate the chart series and is skipped.
Why did a level move after a breakout failed?
That's the wick-adjust rule: price poked through and closed back inside, so the level relocated to the new wick extreme — the true rejection price. Turn Adjust level to wick on failed break off to pin levels at their original pivot price.
Why does the arrow sometimes fire but the line stays?
By design. The arrow marks the first close beyond the buffer; the line survives until three consecutive closes beyond. A close back inside between them means the break attempt failed and the level lives on — which is exactly the information you want.
New: want the arrows traded mechanically — entry at the arrow close, stop beyond the producing candle, target at 1:4, with a win-rate scoreboard? That's Pivot Levels Strategy, built on this exact engine. And for the opposite read — fading the arrows that fail — there's Pivot Reversal, which zones every break and fires when price recloses through the level.
Levels that manage themselves
Pivot Levels is live in the indicator picker on every Crodl terminal chart. Put it on your pair, leave the defaults, and watch the map maintain itself — merged, tagged, adjusted, and retired — while you decide which break deserves your entry.
This article is for educational purposes only and is not financial advice. Leveraged trading carries substantial risk of loss. Always do your own research and never risk more than you can afford to lose.

Ready to automate your trading?
Connect your exchange, set up automations, and start trading smarter — all from one platform.
Start Trading Free