Latch Trend
A close-confirmed trend regime that stays latched until price breaks the active anchor candle, with MTF calculation and calendar resets.
Many trend tools change their mind whenever price crosses a line. That makes them responsive, but it also means a sideways market can flip the chart red-green-red with no meaningful change in structure.
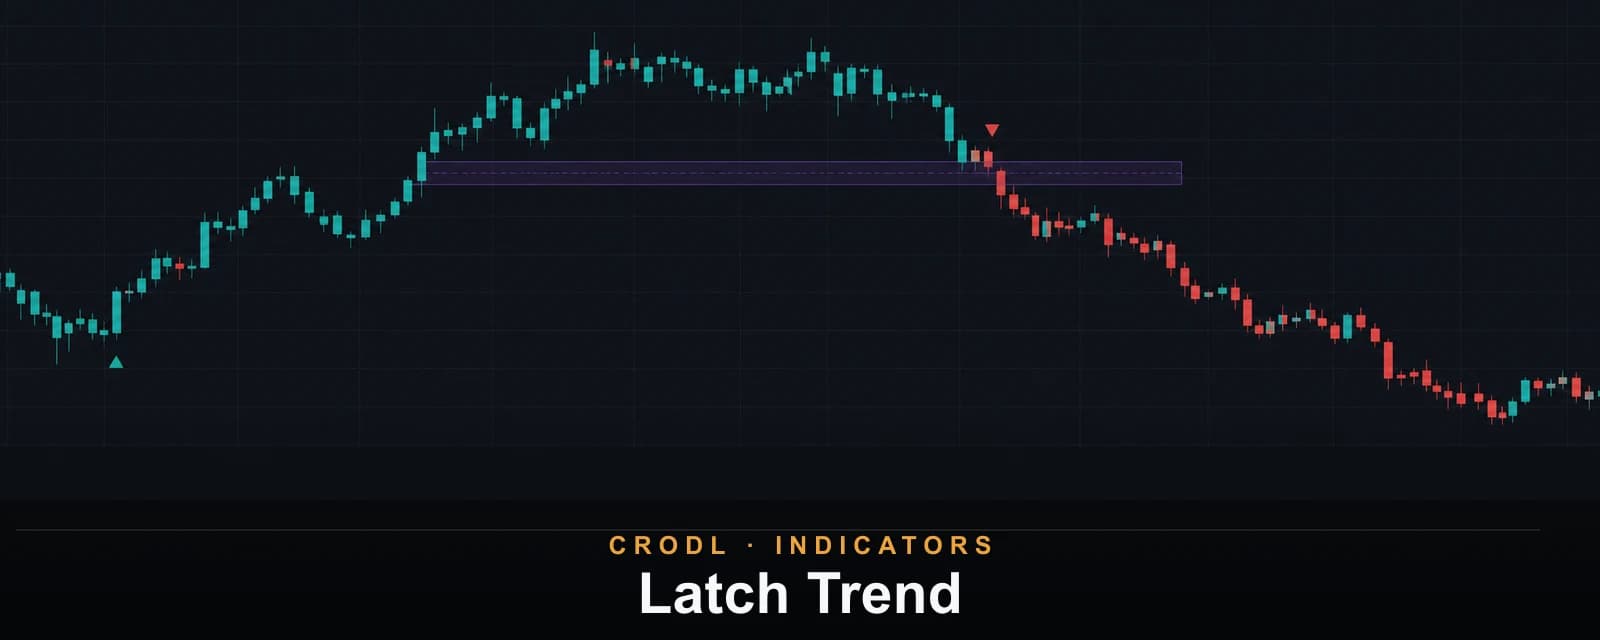
Latch Trend uses memory instead. One closed candle becomes the active anchor, and the regime stays latched until a later candle closes beyond the anchor's opposite boundary. The candle that causes the break becomes the new anchor and belongs to the new regime. Small moves inside the boundary do nothing.
The result is a stable candle-color overlay with an explicit answer to two questions: what regime is active, and what exact candle must price invalidate to flip it?
The latch rule
The first closed candle in a reset period seeds the state from its direction:
- A bullish anchor holds a bullish regime until a candle closes below its lower boundary.
- A bearish anchor holds a bearish regime until a candle closes above its upper boundary.
The breaking candle immediately becomes the opposite anchor. That detail prevents an ambiguous transition bar: the candle that proves the old state wrong is painted in the new state.
By default, boundaries use the candle body. A bullish anchor's lower edge is the lower of open and close; a bearish anchor's upper edge is the higher. Switch Anchor boundary to Full candle (wick) when you want the regime to survive stop-run wicks and require a close beyond the entire range.
What appears on the chart
- Candles are recolored teal in a bull regime and red in a bear regime.
- A faint rectangle marks the active anchor zone.
- Optional triangles mark confirmed flips.
The forming candle inherits the last confirmed color but cannot change the state. A regime flip only commits on a close, so an intrabar poke beyond the anchor cannot repaint the history.
Why the reset exists
Without a reset, an old anchor could remain relevant indefinitely. Latch Trend re-seeds on the first closed calculation candle of each daily, weekly, or monthly bucket in the chart's selected timezone. Weekly is the default: long enough to suppress intraday churn, short enough to prevent an ancient regime from governing a new market week.
The reset must be coarser than the calculation timeframe. If an unsafe combination is selected—daily reset with daily calculation, for example—the study automatically promotes the reset to the next coarser period. That keeps the latch from degenerating into ordinary candle coloring.
Multi-timeframe calculation
Choose Chart or a timeframe from 3 minutes through 1 week. A selected timeframe is used only when it is higher than the chart; equal or lower choices resolve to Chart. Higher-timeframe states are built from completed candles and projected forward, so a 4-hour latch on a 15-minute chart changes only after the 4-hour candle closes.
This makes the indicator useful as a bias layer. Execution can remain on a fast chart while the candle colors represent a slower, more stable regime.
Settings that matter
- Calculation timeframe chooses the regime horizon.
- Anchor boundary switches between body and full wick.
- Reset period chooses daily, weekly, or monthly re-seeding in the chart timezone.
- Color candles, Active anchor zone, and Flip markers can be toggled independently.
- Bull/bear colors and zone opacity are visual only.
How traders use it
Directional permission
The simplest process is long-only during a teal latch and short-only during a red latch. It does not locate the trade; it removes one side of the decision tree.
Anchor-based invalidation
The active zone shows why the current regime still exists. If a long setup forms while the bull latch is active, a confirmed close below the lower anchor boundary is a natural point to stop defending the thesis.
Higher-timeframe context
Run the latch on 4H and use Price-Action Structure + FVG on the chart timeframe. A lower-timeframe bullish pullback is more interesting when the completed 4-hour latch is also bullish.
Frequently Asked Questions
Why did price cross the zone without flipping?
The rule uses the close, not the wick. In MTF mode, it also waits for the selected higher-timeframe candle to complete.
Why did the anchor suddenly reset without a break?
A new day, week, or month began in the chart timezone. Calendar resets deliberately start a fresh state.
Is Latch Trend the same as Supertrend?
No. Supertrend follows an ATR stop. Latch Trend has no rolling band; it holds a discrete candle boundary until a confirmed close invalidates it.
Make trend changes earn the flip
Add Latch Trend from the Crodl indicator picker when you want regime colors that change only after price proves the active anchor wrong.
This article is for educational purposes only and is not financial advice. Leveraged trading carries substantial risk of loss. Always do your own research and never risk more than you can afford to lose.

Ready to automate your trading?
Connect your exchange, set up automations, and start trading smarter — all from one platform.
Start Trading Free