Price-Action Structure + FVG
A clean price-action map combining break-of-structure trend, the latest swing levels, and one trend-aligned fair value gap at a time.
Most structure charts fail by showing too much. Every pivot gets a label, every imbalance becomes a box, and within a few sessions the candles disappear behind the analysis. The information may be technically correct, but the map is no longer useful.
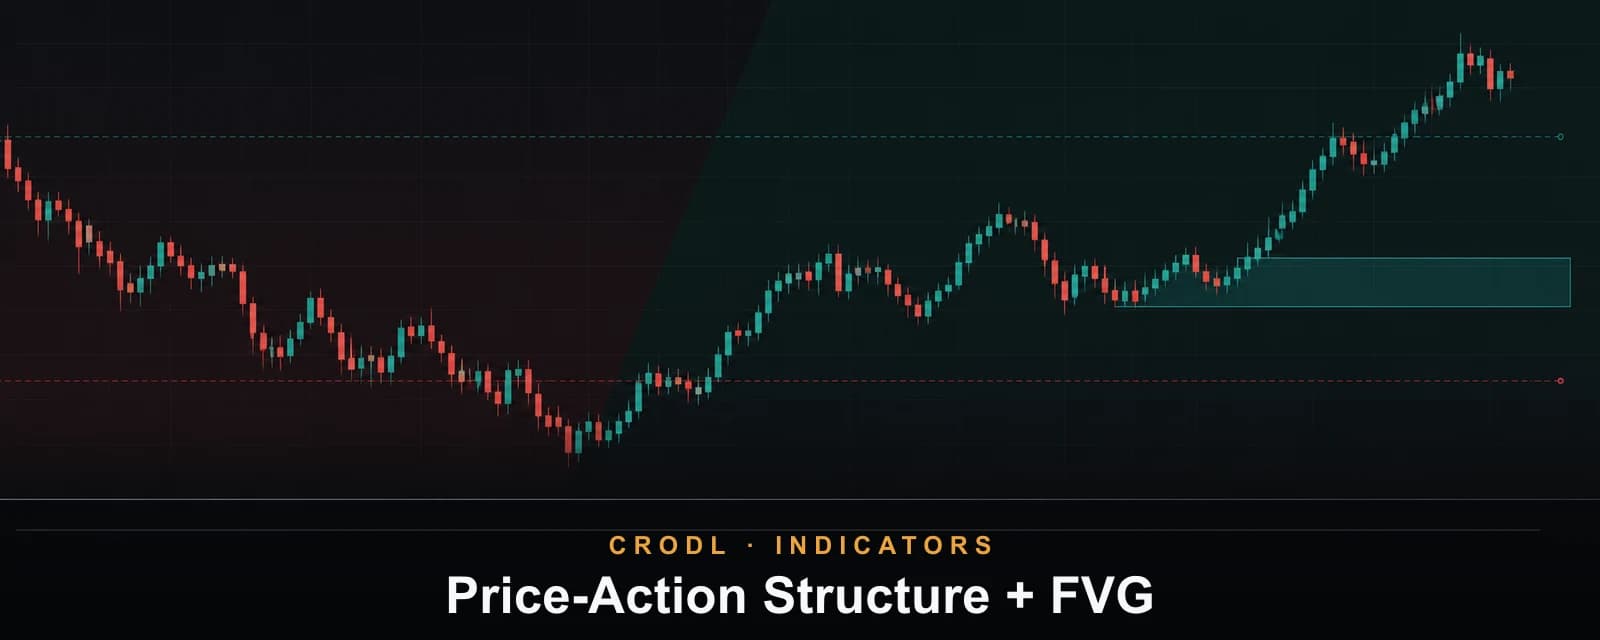
Price-Action Structure + FVG on the Crodl terminal takes the opposite approach. It keeps only the three things a pullback trader needs in view: the current break-of-structure trend, the latest confirmed swing high and low, and one fair value gap aligned with that trend. There are no entry arrows and no oscillator pane. The study supplies context and location; the trader still decides whether the reaction is worth trading.
What the indicator shows
- A faint green background after price closes above the latest swing high, or red after it closes below the latest swing low.
- Two gray step-lines marking the most recently confirmed swing high and swing low.
- A teal bullish or violet bearish Fair Value Gap (FVG) in the permitted direction.
The background is a regime, not a prediction. It stays in its last state until an opposing structure level is broken. The swing lines show exactly what price must close through to change that state.
The Calculation timeframe can use the chart or a completed higher timeframe from 3 minutes through 1 week. A 4-hour selection on a 15-minute chart runs the entire pivot, break-of-structure, FVG, mitigation, and box-age sequence on actual 4-hour candles, then projects the confirmed map onto the execution chart.
How the structure engine works
A swing high must remain the highest high within Swing lookback bars on both sides; a swing low is the mirror image. With the default lookback of 10, the candidate needs ten later bars before it is confirmed. That delay is deliberate: a pivot cannot be known at the instant it forms without looking into the future.
Once confirmed, the latest high and low become the live structure boundaries:
| Close event | New regime |
|---|---|
| Close above the latest swing high | Bullish |
| Close below the latest swing low | Bearish |
| Price remains between both levels | Previous regime holds |
Unlike the separate Market Structure indicator, this study does not stamp BOS or CHoCH events or consume a broken level. Its job is a persistent directional map: the last confirmed levels remain visible while the background records which side most recently won.
Why it draws only one FVG at a time
A bullish FVG exists when the current candle's low is above the high from two candles earlier. The untouched interval between those prices is the gap. A bearish FVG exists when the current high sits below the low from two candles earlier.
With FVGs in trend direction only enabled, a bullish gap can arm only in a green regime and a bearish gap only in a red regime. The gap must also meet Min FVG size, expressed as a percentage of price. Once a zone is active, later gaps are ignored until price reaches its midpoint or its configured width expires. The slot then opens for the next valid gap.
That one-slot rule is the point. The full Fair Value Gaps indicator is better for studying every imbalance and inversion. Price-Action Structure + FVG is for answering one practical question: where is the current trend-aligned pullback zone?
Historical boxes remain on the chart at their fixed width so the sequence can still be reviewed. “Mitigation” frees the live slot; it does not retroactively erase the box.
Settings that matter
- Calculation timeframe defaults to Chart. Higher selections use completed candles only, so a structure change becomes visible on the first chart bar after the source candle closes.
- Swing lookback (default 10) controls how structural the pivots are. Lower values react faster and change regime more often; higher values ignore minor swings.
- Shade trend background and Show swing high/low let you simplify the visual without changing the calculation.
- FVGs in trend direction only is on by default. Turn it off to allow either direction while keeping the one-zone rule.
- Min FVG size (default 0.05% of price) filters tiny three-candle gaps.
- FVG box width (default 30 bars) controls both the drawn width and when an untouched setup becomes stale.
- Bullish/bearish colors and transparency affect presentation only.
A practical workflow
Start with the background, then the levels, then the zone. In a green regime, the swing low is the structural invalidation reference and the live bullish FVG is the pullback location. A reaction inside the gap that holds above structure supports continuation; a close below the swing low changes the premise rather than merely producing a bad entry.
For a higher-timeframe bias with lower-timeframe execution, select 2H or 4H directly in the study instead of changing the chart. The original framework is most selective around that horizon; on faster calculations three-candle gaps occur constantly, so spread, fees, and confirmation matter much more.
Frequently Asked Questions
Does it repaint?
Confirmed pivots do not move after the required right-side bars have completed. The current candle can still temporarily break a level or form an FVG while it is open, so live-bar visuals may change before the close. Treat the closed candle as final.
In higher-timeframe mode, the developing source candle is excluded entirely: its structure and gaps appear only after it closes.
Why is an obvious FVG missing?
The indicator may already have an armed zone, the gap may be smaller than the percentage filter, or its direction may disagree with the current regime. Use the full FVG study when you want every gap.
Is the FVG midpoint an entry signal?
No. The midpoint is the point that frees the active slot. It is a useful reaction reference, not a command to trade.
Keep the map clean
Add Price-Action Structure + FVG from the indicator picker on any Crodl chart. It gives price enough room to remain readable while keeping the current trend, structural boundaries, and next aligned imbalance in one view.
This article is for educational purposes only and is not financial advice. Leveraged trading carries substantial risk of loss. Always do your own research and never risk more than you can afford to lose.

Ready to automate your trading?
Connect your exchange, set up automations, and start trading smarter — all from one platform.
Start Trading Free