Breadth Trend
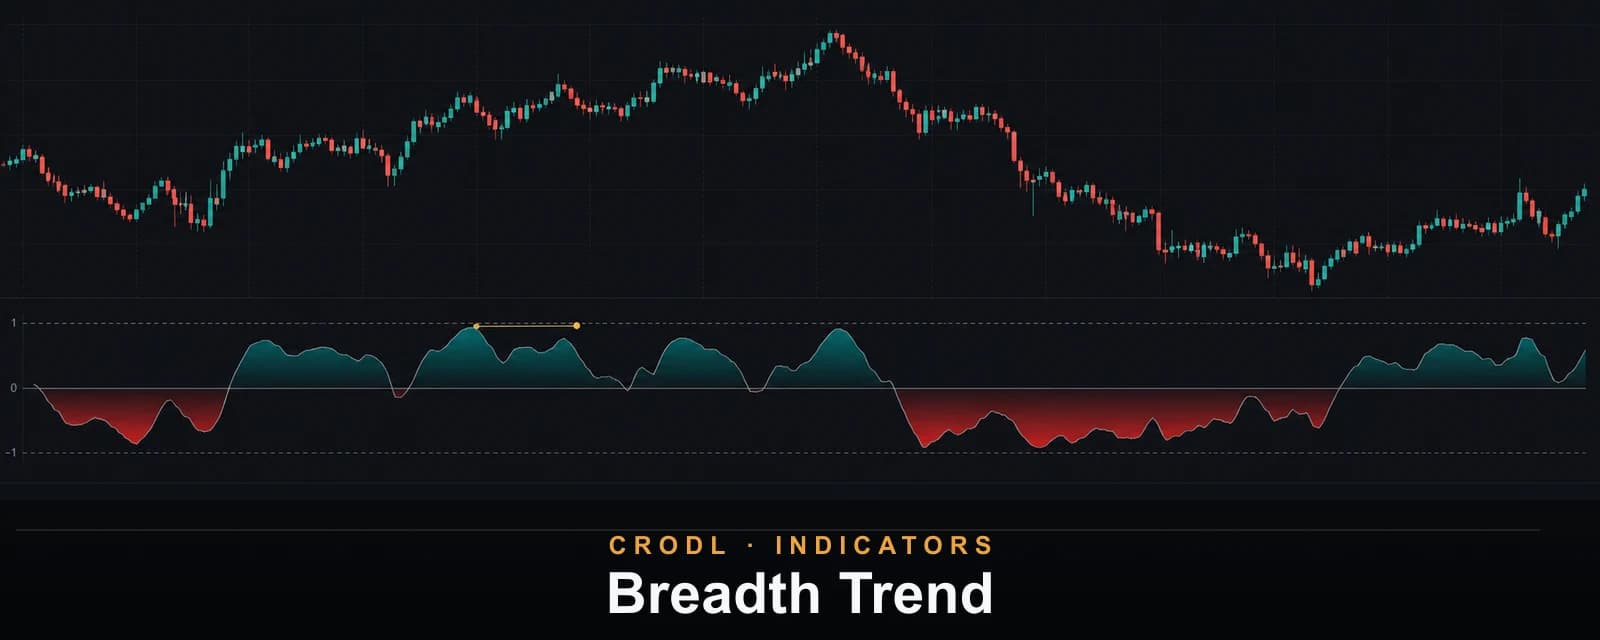
Score upward versus downward range expansion on a normalized −1 to +1 scale, confirm regime changes, and mark liquidity sweeps with weaker breadth.
An uptrend is not just a sequence of green candles. What matters is whether highs keep extending farther than lows, and whether that directional expansion persists across a meaningful window. Breadth Trend compresses that contest into a normalized reading from −1 to +1, then adds confirmation so one contrary bar cannot instantly flip the regime.
Despite the name, this is not cross-asset breadth. It measures the internal directional breadth of one market: how much upward range extension occurred versus downward extension over the chosen horizon.
The default score
For every bar, the study compares the current high and low with the prior bar:
- Positive directional extension is the amount by which the high expands upward, when it exceeds the competing downside move.
- Negative directional extension is the amount by which the low expands downward, when it exceeds the competing upside move.
Those extensions are summed over Lookback (hours), six hours by default. The normalized score is:
(upward extension − downward extension) / (upward extension + downward extension)
The result stays between −1 and +1. Positive values mean upside range expansion dominated; negative values mean downside expansion dominated. Zero means neither side gained net ground.
Alternative scoring methods
- Magnitude-weighted preserves how far each winning side extended and is the default.
- Count × average move combines break frequency with average bullish or bearish body size.
- Count only compares new-high bars with new-low bars.
- Green vs red candles compares candle direction counts without requiring range extension.
All methods answer the same directional question with different definitions of evidence. Keep the method fixed when comparing symbols or timeframes.
Hours, not arbitrary bars
The lookback is expressed in hours and converted to bars from the calculation resolution. Six hours means 72 bars on 5-minute data and six bars on 1-hour data. This keeps the time horizon consistent when the chart changes resolution.
The Timeframe input can calculate on the chart or a supported higher timeframe. In HTF mode, windowed sums and confirmation advance on completed measure-timeframe buckets, then project onto the chart.
Confirmation and the ±1 state
The gray line is the raw score. The colored state sits at +1 for long and −1 for flat/short. With confirmation enabled, the state flips only after raw breadth holds the opposite side for Bars to confirm consecutive measure bars—10 by default.
The streak resets immediately if raw returns to the held side. Ten scattered negative bars cannot slowly chip away at a bullish state; they must be consecutive. Disable confirmation to flip on the first opposite-side bar.
Sweep divergence markers
The study records confirmed price pivots and the breadth reading at each pivot. When price later sweeps that high or low, it compares current breadth with the stored reference:
- A high sweep with weaker breadth prints a yellow downward marker.
- A low sweep with stronger breadth prints a yellow upward marker.
These are labeled divergent sweeps, but the implementation treats them as a continuation read of the break, not an automatic reversal call. Optional gray dots mark sweeps whose breadth confirms rather than diverges. Each reference can fire only once.
Settings that matter
- Timeframe selects chart, 5m, 15m, 30m, 1H, 4H, or 1D measurement.
- How to score each bar chooses the evidence model.
- Lookback (hours) sets a consistent time horizon.
- Require N bars / Bars to confirm control state hysteresis.
- Pivot strength controls the sweep reference level.
- Raw line, divergent sweeps, confirmed sweeps, and colors are independently configurable.
How traders use it
Breadth Trend is strongest as a filter. A breakout above S/R resistance with raw breadth expanding above zero and the confirmed state already at +1 has directional participation behind it. A price breakout while breadth remains deeply negative is a reason to reduce conviction or wait for confirmation.
The sweep markers add context around liquidity. Pair them with Equal Highs/Lows to see whether a taken level arrived with stronger or weaker internal expansion than the pivot it cleared.
Frequently Asked Questions
Why is the state still green after raw crossed below zero?
Confirmation requires the configured number of consecutive opposite-side measure bars. The raw line shows the developing evidence; the state shows the accepted regime.
Why does the same hour setting use different bar counts?
That is intentional. The indicator converts hours into bars from the measure timeframe so the elapsed lookback stays consistent.
Is this market-wide breadth?
No. It analyzes one symbol's directional range expansion. It does not count advancing and declining coins across an index.
Measure which side is actually extending range
Add Breadth Trend from the Crodl indicator picker for a normalized directional state, explicit confirmation, and sweep context that stays comparable across timeframes.
This article is for educational purposes only and is not financial advice. Leveraged trading carries substantial risk of loss. Always do your own research and never risk more than you can afford to lose.

Ready to automate your trading?
Connect your exchange, set up automations, and start trading smarter — all from one platform.
Start Trading Free