VWAP Liquidation
Plot estimated 5x–100x liquidation ladders around daily VWAP, either tracking fair value or freezing as static rails from the day-open VWAP.
Liquidation maps need an entry assumption. Some tools seed leveraged positions at swing highs and lows; VWAP Liquidation uses the session's volume-weighted fair price instead. The premise is simple: if a meaningful share of leveraged traders entered around daily VWAP, where would approximate forced-exit pressure sit for common leverage tiers?
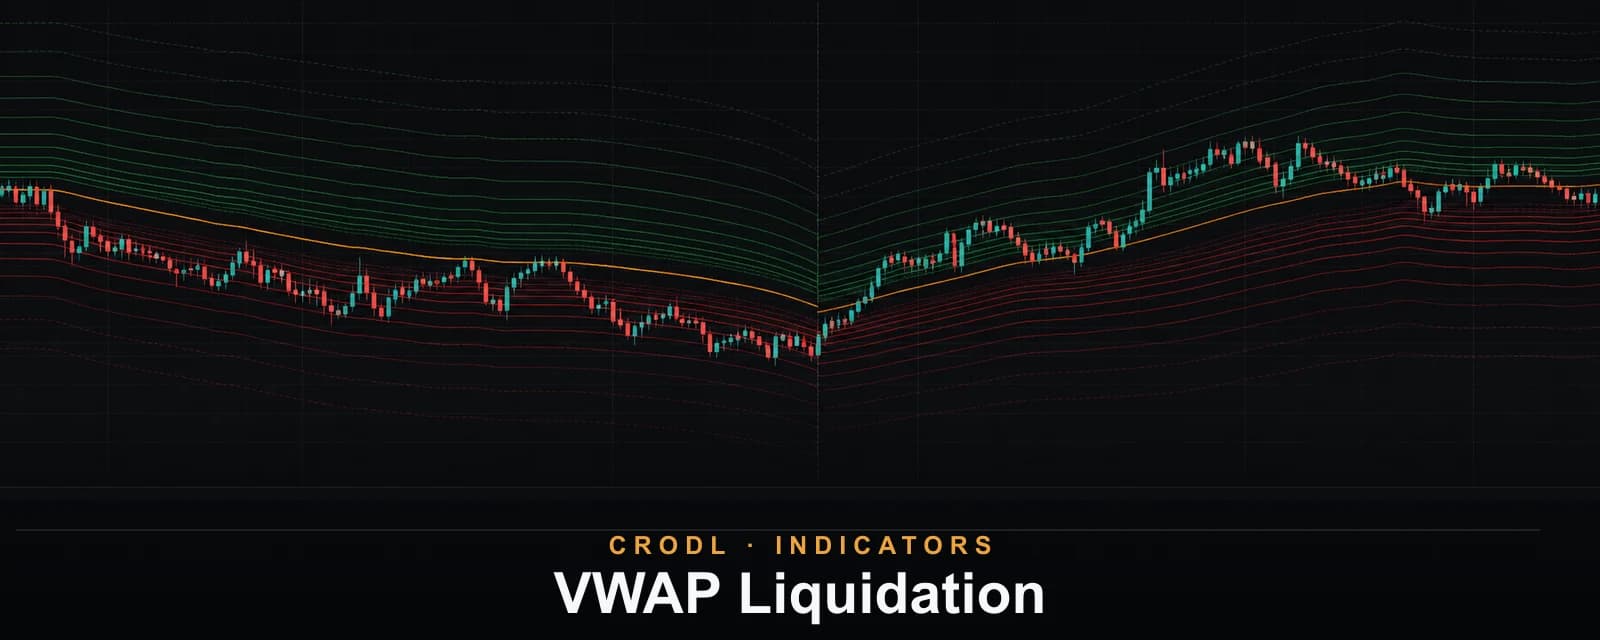
The indicator draws the daily VWAP in orange, estimated long-liquidation ladders below it in red, and short-liquidation ladders above it in green. Six tiers—from 5x through 100x—show how leverage compresses the distance between entry and liquidation.
The level calculation
For an assumed entry price base and leverage L, the simplified estimates are:
- Long liquidation:
base × (1 − 1 / L) - Short liquidation:
base × (1 + 1 / L)
At 100x, levels sit roughly 1% around the base. At 5x, they sit roughly 20% away. The full ladder includes 5x, 10x, 25x, 50x, 75x, and 100x. Higher-leverage rails are drawn brighter and thicker because they cluster closest to fair value.
These are symmetric estimates, not exchange liquidation formulas. Maintenance margin, fees, account equity, isolated versus cross margin, and exchange rules move real liquidation prices inward. The overlay maps potential pressure; it does not calculate an individual account's bankruptcy price.
Two ways to define the base
Track VWAP
The default base is the running daily VWAP. As volume and price update through the UTC day, the liquidation rails curve with fair value. This mode answers: where would the ladder sit if the crowd's average entry followed the session's current VWAP?
Static from day-open VWAP
Static mode freezes the base at the first VWAP value of the UTC day—the first bar's typical price, where the session VWAP is born. The result is a set of flat rails that remain fixed until the next day begins. This mode is easier for orders and alerts because the reference does not drift intraday.
Both modes break the lines at UTC day boundaries. Connecting yesterday's ladder to today's reset would draw a diagonal level that never existed.
Reading the ladder
The closest 75x and 100x rails describe fragile leverage near fair value. They are crossed frequently and are best treated as local pressure bands, not major targets. The wider 10x and 5x rails represent much larger adverse moves and are more relevant during exceptional session volatility.
The side labels follow the position being liquidated:
- Long liqs sit below the base and are red.
- Short liqs sit above the base and are green.
This naming can feel backward at first: the green line is not a bullish position; it is the price area where short positions may become forced buyers.
Settings that matter
- Levels chooses Track VWAP or Static from day-open VWAP.
- Every leverage tier can be toggled independently.
- Daily VWAP line can be hidden when another VWAP study is already present.
- Leverage labels add compact right-edge tier pills.
- Long-liquidation, short-liquidation, and VWAP colors are editable.
How traders use it
Map nearby squeeze fuel
When price holds above VWAP and approaches a dense cluster of close short-liquidation rails, the ladder shows where forced buying could accelerate an already bullish move. The mirror applies below VWAP for long liquidation pressure.
Compare fair value with swing-based levels
Liquidation Levels seeds positions from confirmed swings; VWAP Liquidation seeds them from session fair value. When a VWAP tier overlaps a swing-derived tier or an S/R zone, two different entry assumptions point to the same price.
Frame an extreme day
The outer 5x and 10x rails give a consistent percentage frame around VWAP. Price reaching them does not guarantee a reversal, but it makes clear that the session has moved far beyond its volume-weighted center.
Frequently Asked Questions
Are these actual exchange liquidation positions?
No. The chart has no account-level leverage or maintenance-margin data. The levels are transparent mathematical estimates around an assumed VWAP entry.
Why do the levels move?
Track mode uses the running daily VWAP, which changes as each candle contributes price and volume. Use Static mode when you need fixed rails.
Why are long liquidations below and short liquidations above?
Longs are forced out after price falls against them; shorts are forced out after price rises. The colors identify the liquidated side and resulting pressure.
Put leverage around fair value
Add VWAP Liquidation from the Crodl indicator picker to place a transparent 5x–100x leverage frame around the daily volume-weighted center—moving with fair value or frozen from the session open.
This article is for educational purposes only and is not financial advice. Leveraged trading carries substantial risk of loss. Always do your own research and never risk more than you can afford to lose.

Ready to automate your trading?
Connect your exchange, set up automations, and start trading smarter — all from one platform.
Start Trading Free