
HTF Candles: See the 4-Hour Chart Without Leaving the 15-Minute
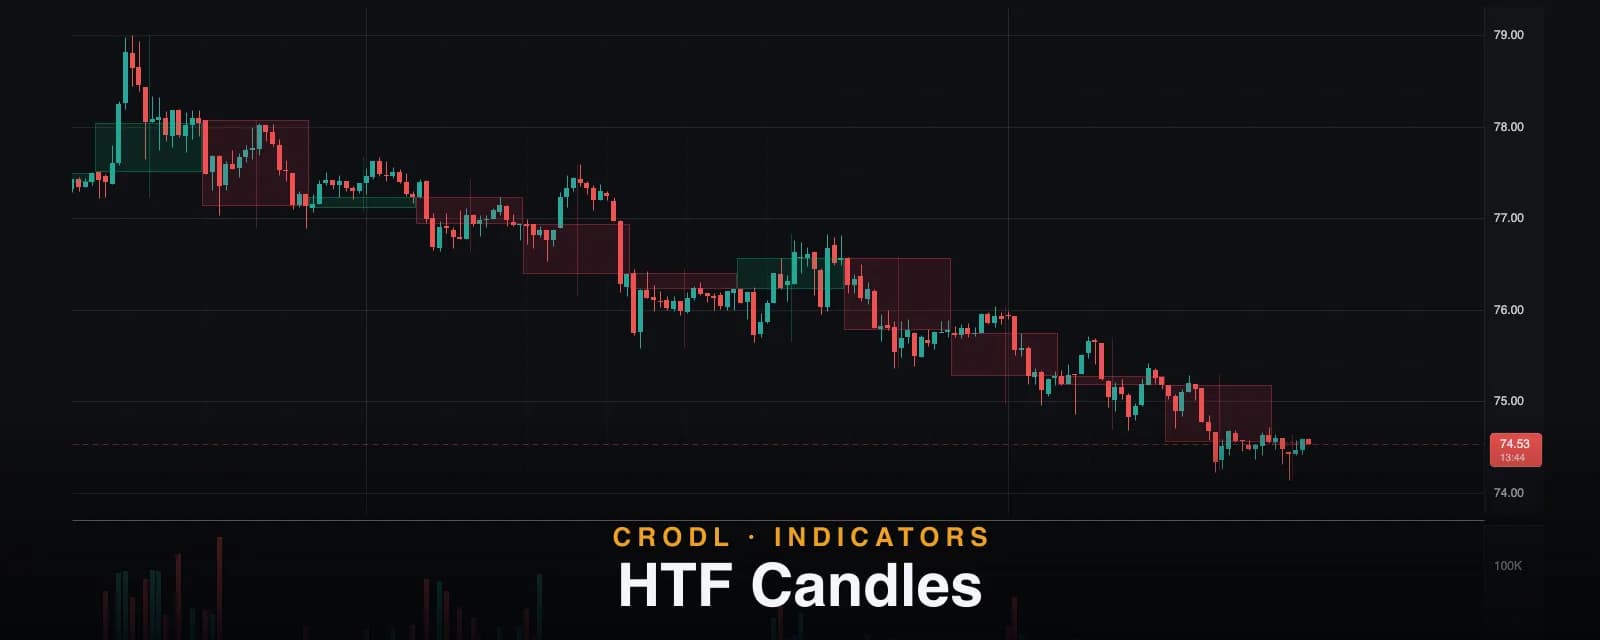
HTF Candles draws translucent higher-timeframe ghost candles behind your chart — auto-mapped or fixed from 3m to 1W, with dashed still-forming periods.
Every multi-timeframe trader runs the same loop: flip to the 4-hour for structure, flip back to the 15-minute for the entry, then hold a mental picture of the higher timeframe while the lower one scrolls. The picture fades exactly when it matters — mid-trade, with the 4h candle developing against you.
HTF Candles on the Crodl terminal ends the flipping. It resamples your loaded chart into higher-timeframe candles and draws them as translucent "ghost" candles directly over price — full bodies, borders and wicks, tiled period by period — so the 4-hour structure is permanently visible behind your 15-minute entries. It lives in the indicator picker like any built-in, and it is deliberately whisper-light: a backdrop that reads as context and never competes with the candles or your other indicators.
What it draws
For each higher-timeframe period, the study aggregates every loaded chart bar inside it — first open, highest high, lowest low, last close — and renders one ghost candle: a translucent body tinted teal (bull) or rose (bear), a thin border, and a centered vertical wick spanning the period's high and low. Bodies widen to tile edge to edge, so adjacent ghosts read like a real candle series rather than floating rectangles. An optional setting adds a faint neutral boundary line at each period's start.
Because the ghosts are painted first in the overlay pass, every other indicator you run — profiles, zones, levels — draws on top of them. And when you zoom far out and the ghosts compress to slivers, they gracefully drop their borders and wicks and keep only the tinted fill, so the backdrop never saturates into a wash.
Auto mode and the timeframe ladder
The one setting most traders will ever touch is Higher timeframe, and its default — Auto — picks a sensible multiple of whatever chart you are on:
| Chart timeframe | Auto picks |
|---|---|
| 5m or faster | 1h |
| Above 5m, up to 1h | 4h |
| Above 1h, up to 4h | 1D |
| Above 4h | 1W |
Prefer a fixed pairing? The selector offers the full terminal ladder above one minute: 3m, 5m, 15m, 30m, 1h, 2h, 4h, 6h, 8h, 12h, 1D, 3D and 1W. One rule is enforced strictly: the pick must be higher than your chart's own timeframe, or the study renders nothing — ghosting your own timeframe (or a lower one) would just redraw the chart on top of itself.
Honest rendering rules
Three details keep the ghosts truthful, and all three are visible on the chart:
- The developing candle draws dashed. The newest period is still forming — its high, low and close move with every tick, and its body grows rightward until the period rolls. It is rendered (watching the 4h candle develop is half the point), but its border is dashed so a still-forming ghost can never be mistaken for a completed one. Completed periods are deterministic from history and never change.
- A truncated first candle draws dashed too. If your loaded history starts mid-period, the oldest ghost aggregates only the bars you have — its open and extremes may be cut short. It renders with a dashed border and no left boundary line, because that left edge is where your data starts, not where the period started. Scrolling left to load more history completes it.
- Weeks start on Monday. Weekly ghosts are anchored to Monday 00:00 UTC, matching exchange and TradingView weekly candles. Intraday and daily buckets are pure UTC-aligned periods, which also match exchange candles; 3D is counted in fixed three-day steps from the epoch rather than from calendar months.
How traders use it
Trade the lower timeframe inside higher-timeframe structure
The core use case: your entries live on the 15m, but support, resistance and trend live on the 4h. With the ghosts behind price you can see, without leaving the chart, that your long is triggering into the top of a bearish 4h body — or that a 15m breakout is also the 4h reclaiming its open. Pair it with the Market Structure indicator and the lower-timeframe BOS/CHoCH signals gain a higher-timeframe context check.
Read HTF opens, closes and mid-bodies as levels
Each ghost body's edges are the period's open and close — levels that higher-timeframe traders treat as decision points. Watching price interact with the developing ghost's open is the live version of the Period Opens playbook, with the whole candle body visible instead of a single line.
Watch the rejection form in real time
A long upper wick on the 4h is a rejection — but you normally only see it after the period closes. The developing ghost shows the wick growing live: price pushes above the developing body, stalls, and the ghost's wick stretches while its close sinks back inside. Combine that with a daily-range read from ADR Levels and you can often tell exhaustion from continuation while the candle is still open.
Settings that matter
- Higher timeframe (default Auto) — Auto's mapping above, or any fixed rung from 3 minutes to 1 week.
- Wicks (default on) — the centered high-low wick per ghost.
- Period boundaries (default off) — a faint vertical line at each period start; useful on dense charts, noise on sparse ones.
- Bull candle / Bear candle — the two tints, teal and rose by default.
- Opacity (default 100, range 10–100) — a master dimmer over the whole study; even at 100 the ghosts stay deliberately translucent.
An honest note on the resampling
HTF Candles builds its ghosts from the candles already loaded on your chart — it does not fetch a second data feed. That design has consequences worth knowing. The oldest ghost can be truncated until you scroll left (which is why it draws dashed). The developing ghost mirrors your live feed, ticks included. And on chart types whose bars do not each span a fixed slice of clock time — volume candles, Heikin Ashi volume, Renko and range charts — the study deliberately renders nothing, because bucketing variable-time bars into fixed-duration periods would produce confidently wrong candles. On standard time-based charts, the aggregation is exact.
Frequently Asked Questions
Why is nothing showing up?
Two by-design gates cover almost every case: your selected higher timeframe is not strictly above the chart's timeframe (e.g. 4h ghosts on a 4h chart), or you are on a re-bucketed chart type — volume, Heikin Ashi volume, Renko or range — where fixed-time ghosts would be dishonest. Switch to a time-based chart or pick a higher rung and the ghosts appear.
Why is the newest ghost candle dashed?
It is the developing period — still forming, still moving. The dash is an honesty marker: solid borders are reserved for completed candles that can never change. The oldest ghost gets the same dash when your loaded history starts mid-period and its aggregate is truncated.
Do the ghost candles match my exchange's candles?
For intraday rungs, 1D and 1W — yes: buckets are UTC-aligned and weeks are Monday-anchored, the same convention exchanges use. The one caveat is 3D, which counts fixed three-day steps from the epoch; an exchange's own 3D series may anchor differently.
Does it repaint?
No. Completed periods are a deterministic aggregation of history — they render identically on every reload. Only the developing ghost changes, and only because its period is genuinely still open. That is development, not repainting.
Context without the tab-flip
HTF Candles is in the indicator picker on every Crodl terminal chart — add it, leave Auto on, and your entry timeframe and your structure timeframe finally share one screen.
This article is for educational purposes only and is not financial advice. Leveraged trading carries substantial risk of loss. Always do your own research and never risk more than you can afford to lose.

Ready to automate your trading?
Connect your exchange, set up automations, and start trading smarter — all from one platform.
Start Trading Free