

Overlaying Moving Averages Differnt Timeframes on the Top and Bottom of your Chart.
Buy and Sell Volume Indicator. Shows aggresive and weak candles.
Detecting Money Flow on different Time Frames

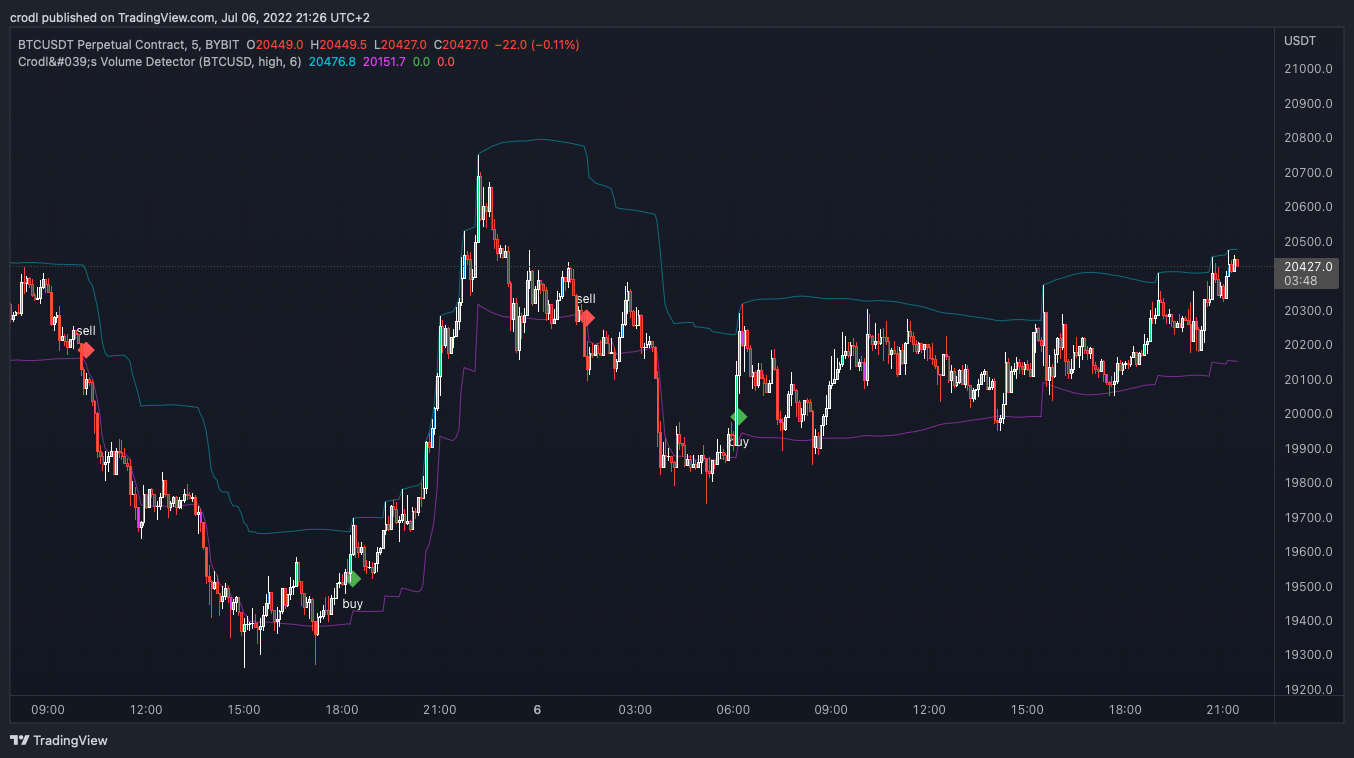
A buy and sell indicator that uses volatility to plot exits helping to catch bigger moves.
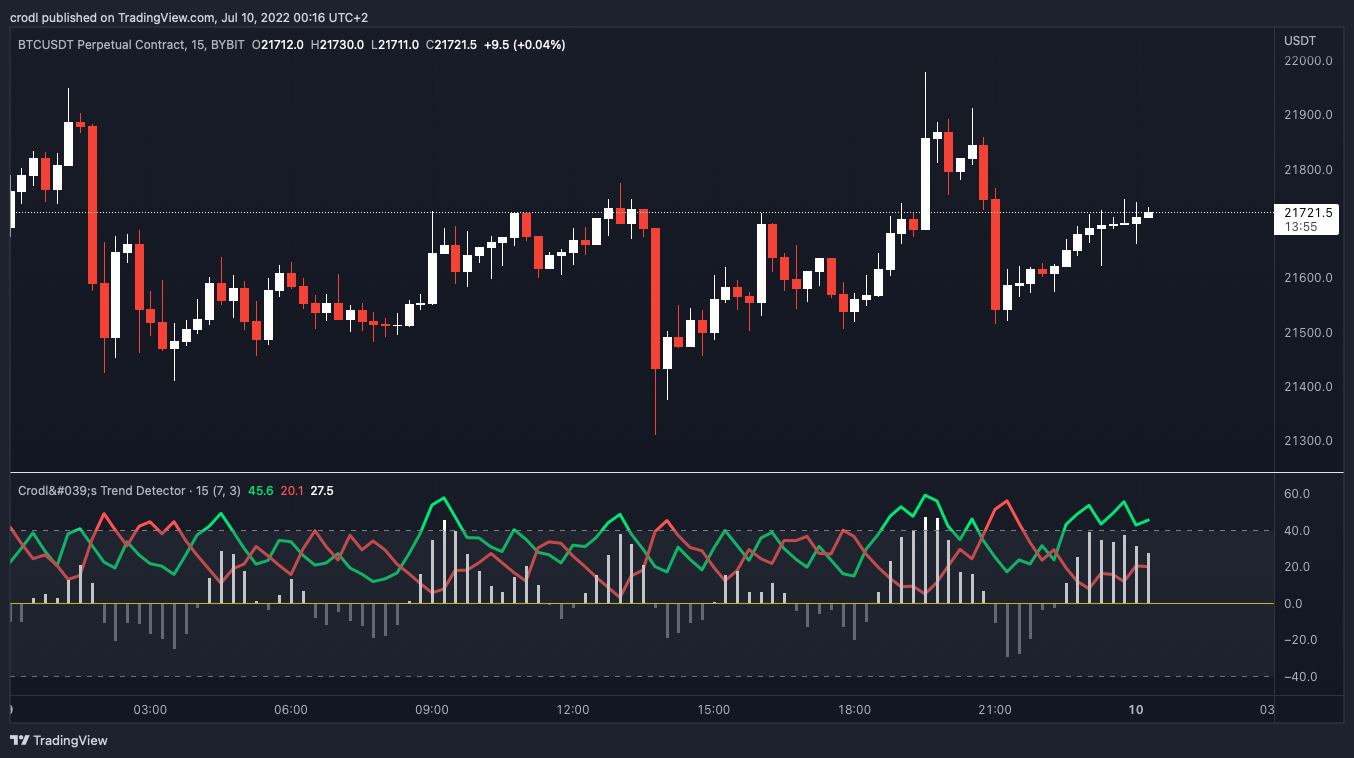
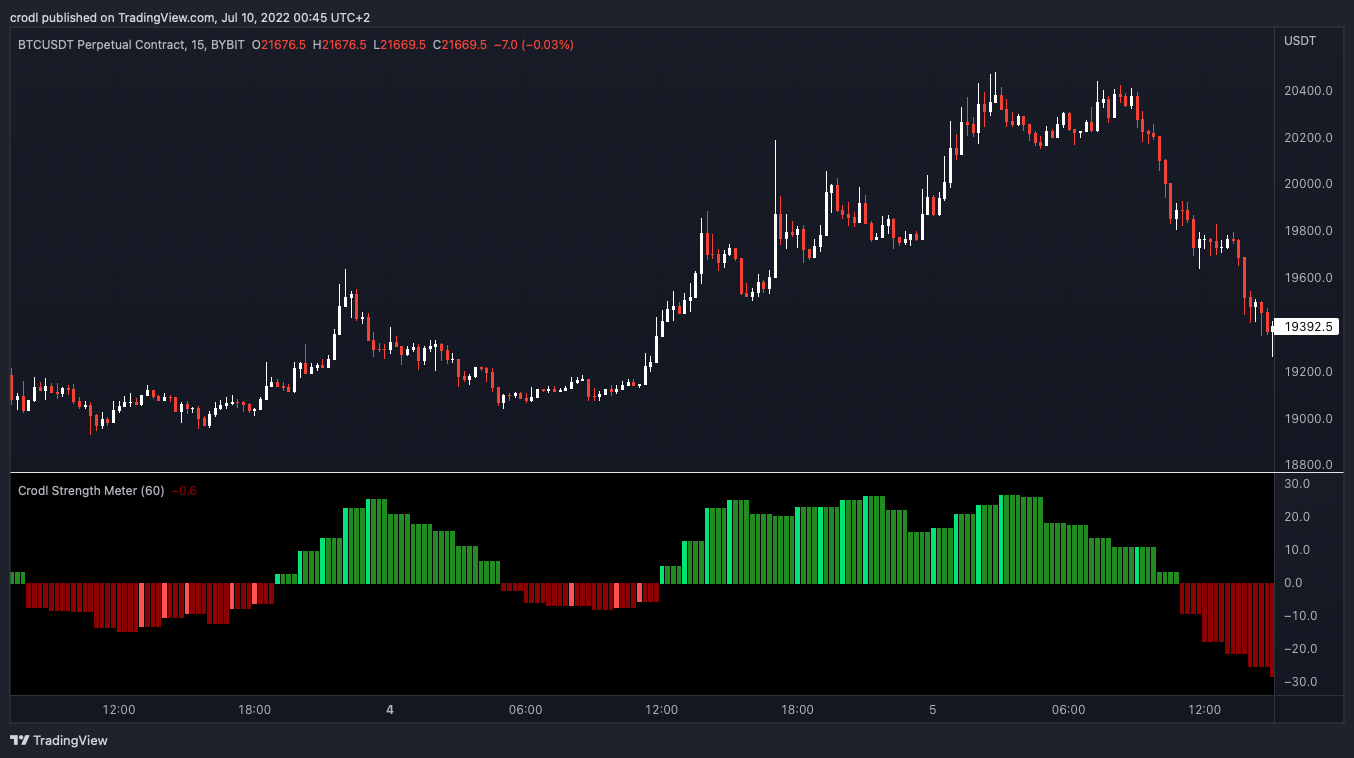
This indicator will show you if Buyers or Sellers are in control.
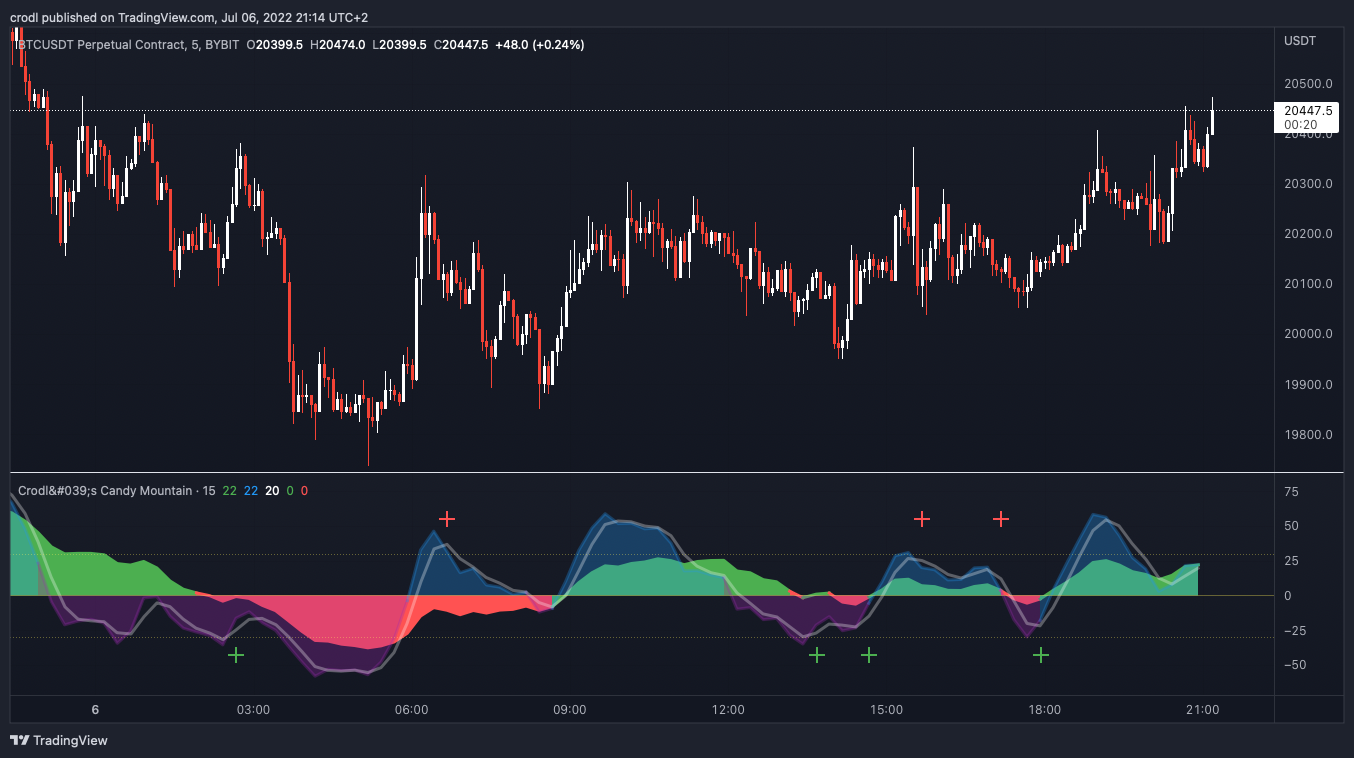
A simple way to read the trend by looking at the momentum of the market. Red = Sellers and green = Buyers.
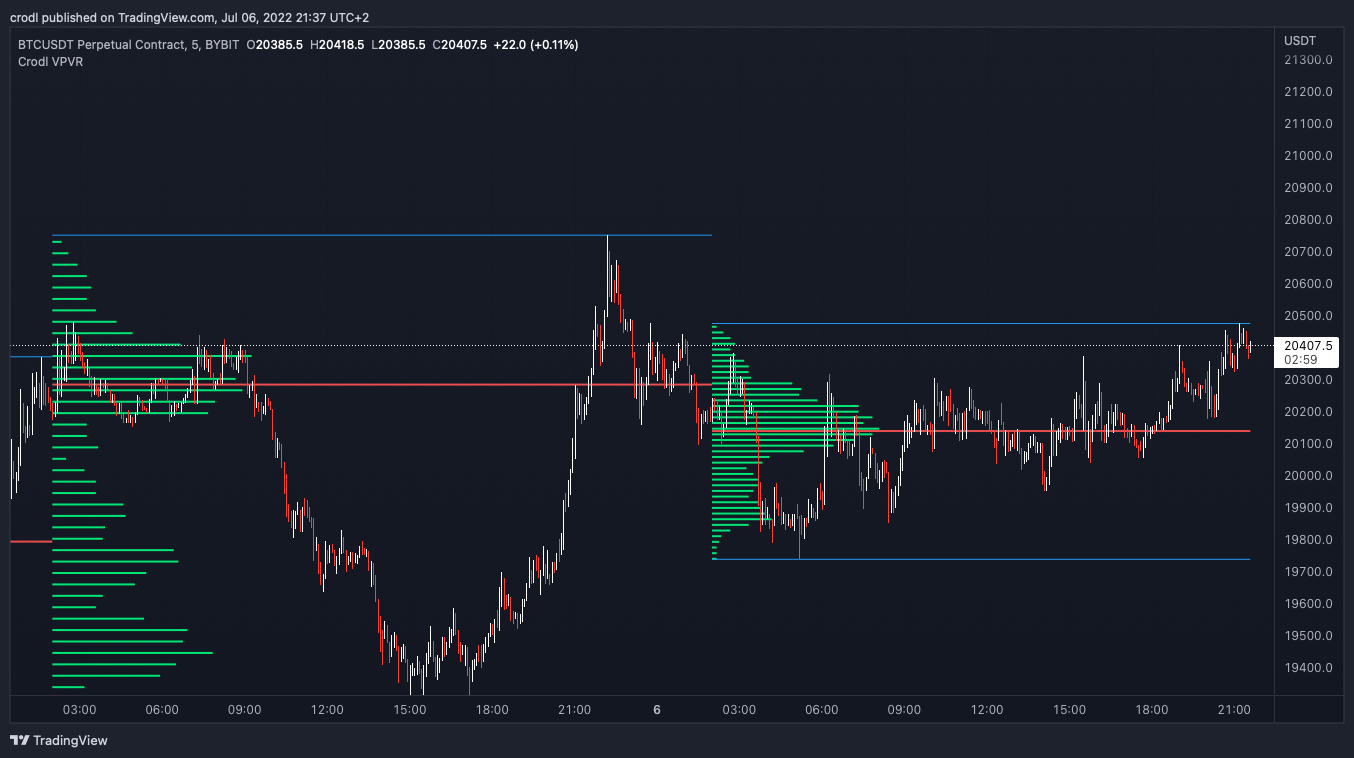
Volume Profile Visible Range is a great tool to have when scalping since price goes back to POC levels a lot.
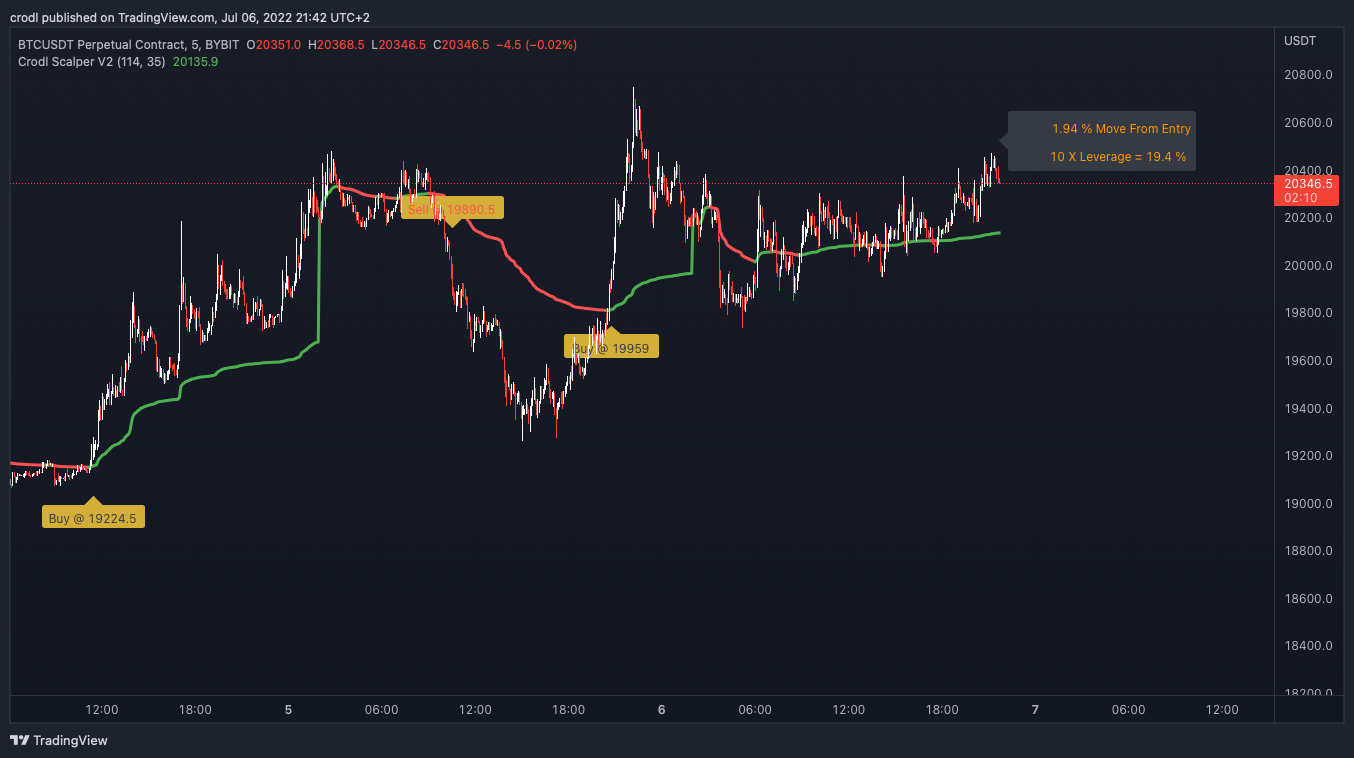
This Buy and Sell indicator will show you how much it has moved as well as the % move from entry.
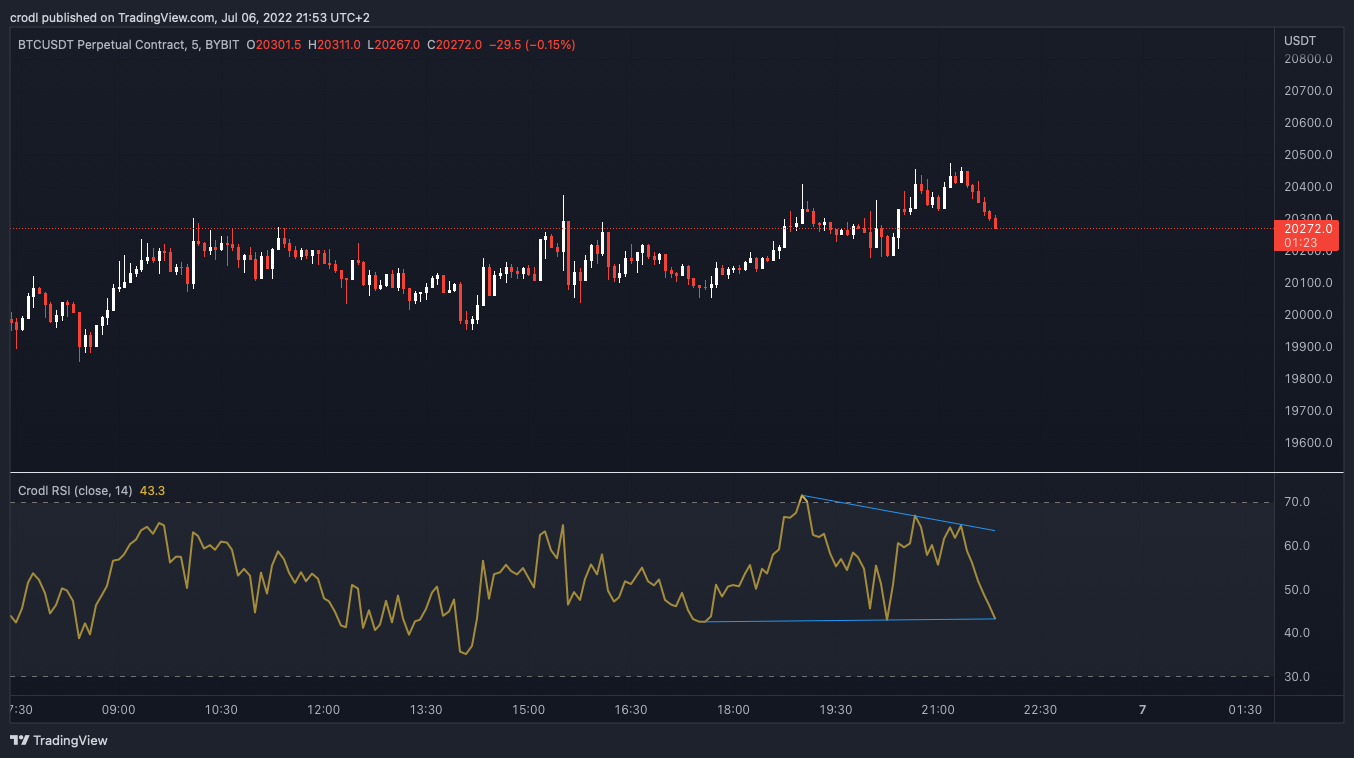
Relative Strength Index that will show your Support & Resistance Areas as well as Divergence.